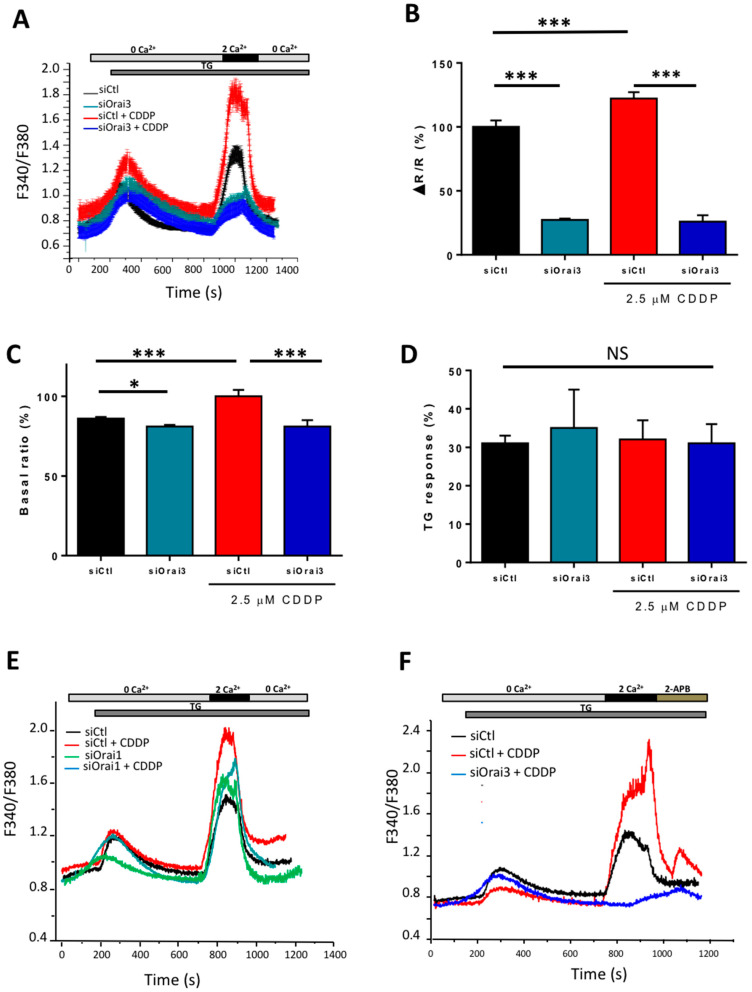
Figure 4.
Functional expression of Orai3 and Orai1 in H23 cell line. Traces representing the SOCE measured with the ratio F340/F380 using calcium imaging technique in H23 cells after Orai1 or Orai3 silencing in the presence of CDDP (A,E,F). Cells were exposed to 1 µM TG in the absence of extracellular Ca2+ which depletes the intracellular Ca2+ stores. Extracellular calcium concentration was then brought to 2 mM in order to induce SOCE (2APB was perfused in F). Quantification of SOCE (B), basal calcium (C) and TG-response (D). All histograms are represented as the average ± SEM normalized to the control. (A–D; siCtl: n = 150, siOrai3: n = 70, siCtl + CDDP: n = 60, siOrai3 + CDDP: n = 34, N = 3), (E; siCtl: n = 116, siOrai1: n = 40, siCtl + CDDP: n = 34, siOrai1+ CDDP: n = 25, N = 3), (F, siCtl: n = 90, siCtl + CDDP: n = 30, siOrai3 + CDDP: n = 26, N = 3). Student’s t-test, * p < 0.05, *** p < 0.001, N.S. statically not significant, n: number of cells, N: number of passages.

