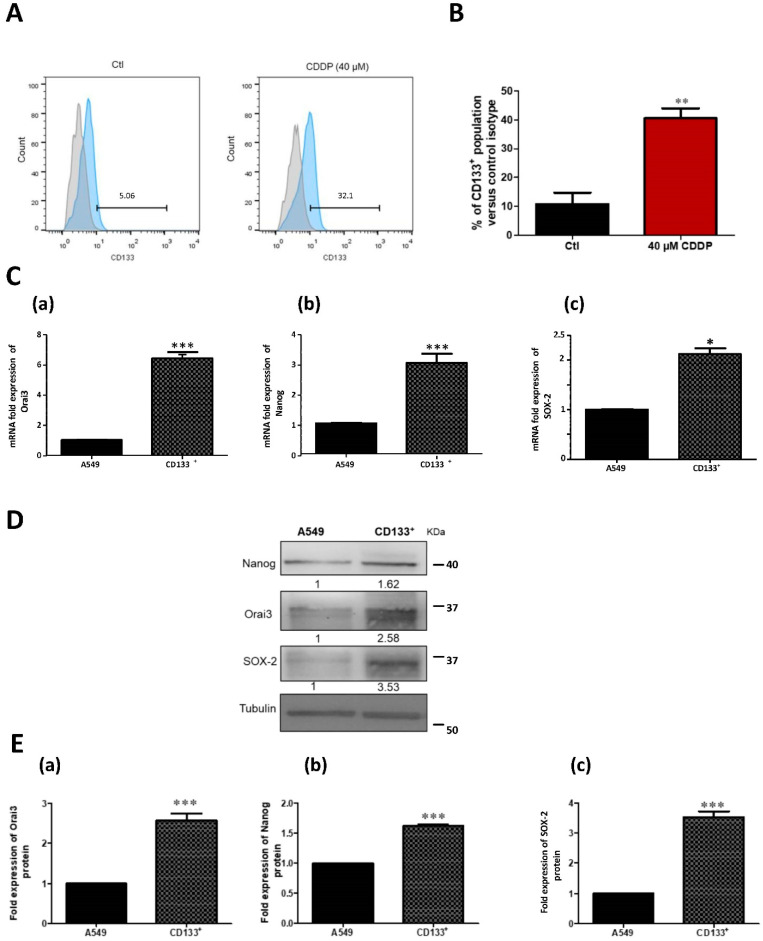
Figure 7.
CDDP treatment in A549 cells increased CD133+ cell population. Flow cytometry representative histogram showing that 40 µM Cisplatin treatment for 48 h increased CD133 expression with respect to control (A) and its respective quantification (B). Bars represent percentage values of CD133+ population of each condition relative to isotype. Student’s t-test, ** p < 0.01, N = 3. The expression of Orai3 and stemness markers in sorted CDDP-induced CD133+ cells vs. parental A549 cells. Relative mRNA expression of Orai3 (C-a), Nanog (C-b) and SOX-2 (C-c). Western blot representing Orai3, SOX-2 and Nanog protein expression (D) with the respective quantifications (E-a, E-b and E-c). Student’s t-test, * p < 0.05, *** p < 0.001, N = 3.

