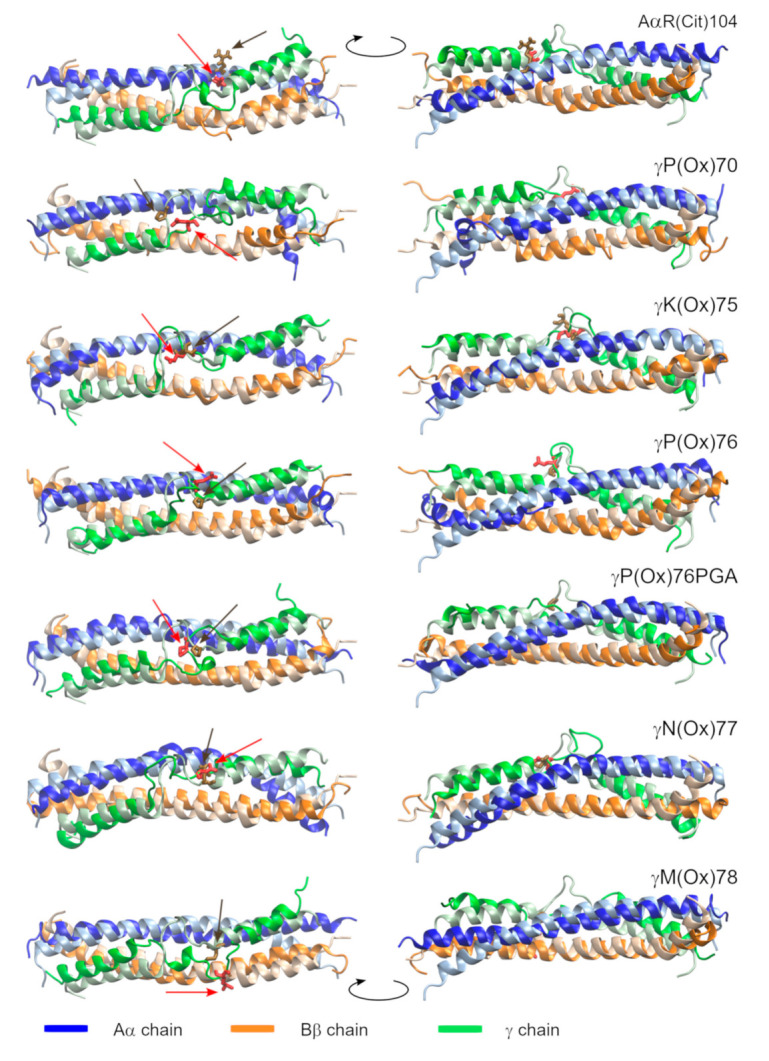
Figure 3.

The geometry of the modified proteins (bright colors) fitted on the pristine fibrinogen (pale colors). The last frames of the MD simulation are shown. Modified AAs are shown in red and highlighted by red arrows. Their pristine counterparts are shown in brown and highlighted by brown arrows. N-termini are at the left part of the figure. The two images of each structure are rotated by 180° according to the axis perpendicular to the coiled-coil domain.
