
Figure 3.
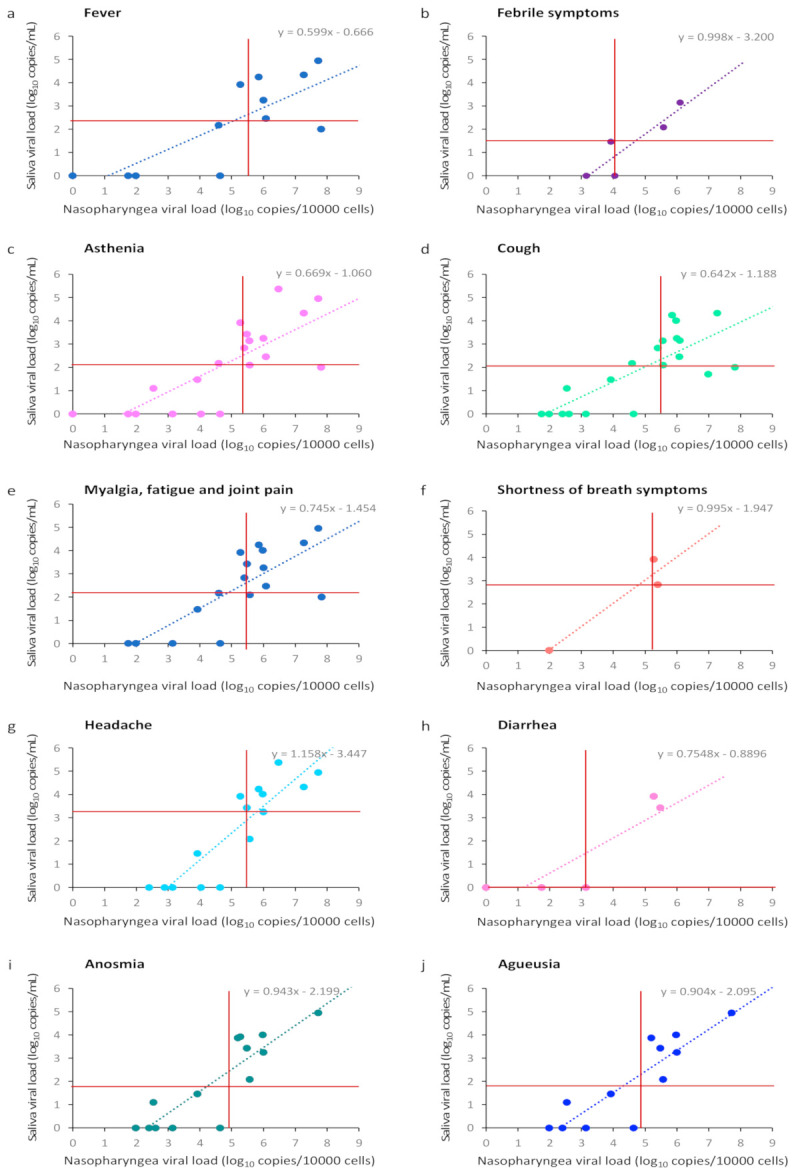
Analysis of SARS-CoV-2 viral load in nasopharyngeal (log10 copies/10,000 cells) and saliva (log10 copies/mL) samples according to clinical symptoms. (a) SARS-CoV-2 values by testing concordance for fever; (b) SARS-CoV-2 values by testing concordance for febrile symptoms; (c) SARS-CoV-2 values by testing concordance for asthenia; (d) SARS-CoV-2 values by testing concordance for cough; (e) SARS-CoV-2 values by testing concordance for myalgia, fatigue, and joint pain; (f) SARS-CoV-2 values by testing concordance for headache; (g) SARS-CoV-2 values by testing concordance for diarrhea; (h) SARS-CoV-2 values by testing concordance for anosmia; (i) SARS-CoV-2 values by testing concordance for anosmia; (j) SARS-CoV-2 values by testing concordance for agueusia. Red horizontal and vertical lines indicate the median.