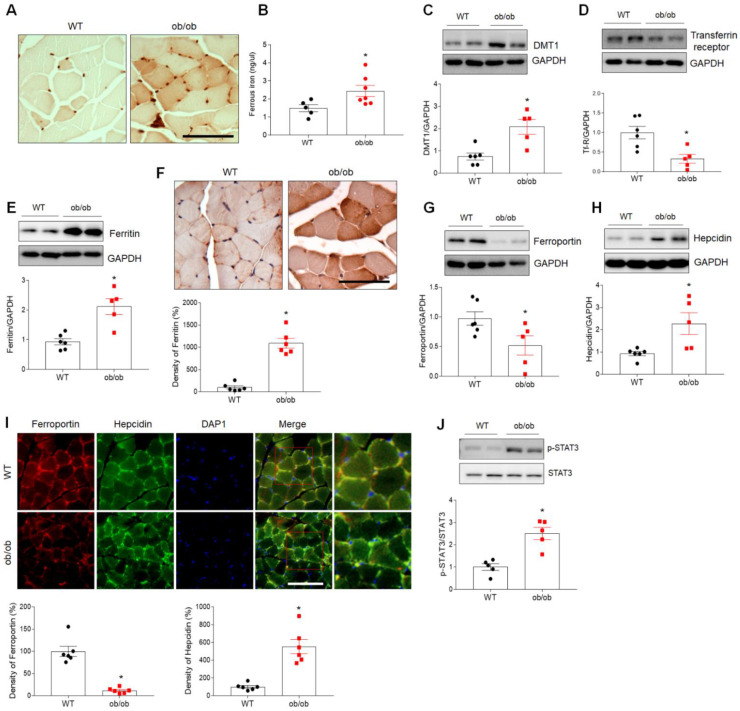
Figure 4.
Increased expression of iron uptake-related proteins in skeletal muscle of ob/ob mice. (A) Histologic staining for iron using Perls’ DAB in skeletal muscle of wild-type (WT) and ob/ob mice. Scale bar = 50 µm. (B) Iron assay results showing levels of ferrous iron in skeletal muscle. (C–E) Western blotting and quantitative analysis of DMT1 (C), transferrin receptor (D), and ferritin (E) expression. GAPDH was used as an internal control to normalize total protein levels. (F) Representative images of immunohistochemical staining and quantitative analysis of the relative immunostained intensity of ferritin in skeletal muscle sections. Scale bar = 50 μm. (G,H) Western blotting and quantitative analysis of ferroportin (G) and hepcidin (H) expression. GAPDH was used as an internal control to normalize total protein levels. (I) Representative double immunofluorescence analysis and quantitative analysis of the relative fluorescent intensity of ferroportin and hepcidin expression in cross-sections of skeletal muscle. Nuclei were counterstained with DAPI. Photos on the far right are enlargements of the areas shown in red squares. Scale bar = 50 μm. (J) Western blotting and quantitative analysis of p-STAT3 and STAT3 expression. Data are shown as the mean ± SEM. * p < 0.05 vs. WT mice.

