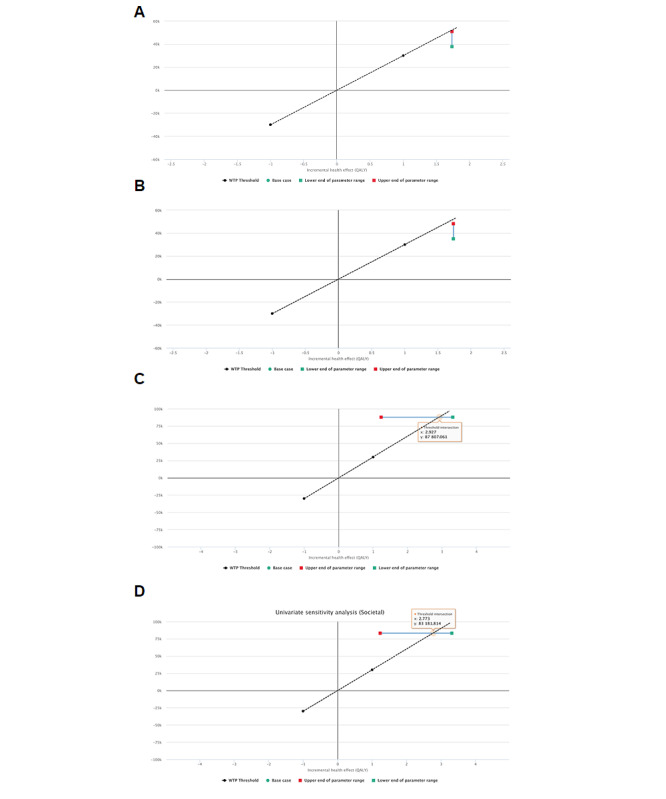
Figure 3.

Cost-effectiveness planes of sensitivity analyses. A reduction of up to 25% in cost per session (A and B for healthcare and societal perspectives, respectively), and 0% to 5% discount in effects (C and D for healthcare and societal perspectives, respectively). The dotted black line shows the 30,000 €/QALY willingness-to-pay threshold (equivalent to approximately US $36,060; an exchange rate of approximately €1 to US $1.20 is applicable at the time of publication). The solid green line shows the range of the incremental cost-effectiveness ratio, with the red and green squares indicating the range extremes for the worse (more costly or less effective) and best (less costly or more effective) scenario, respectively. QALY: quality-adjusted life-year. WTP: willingness-to-pay.
