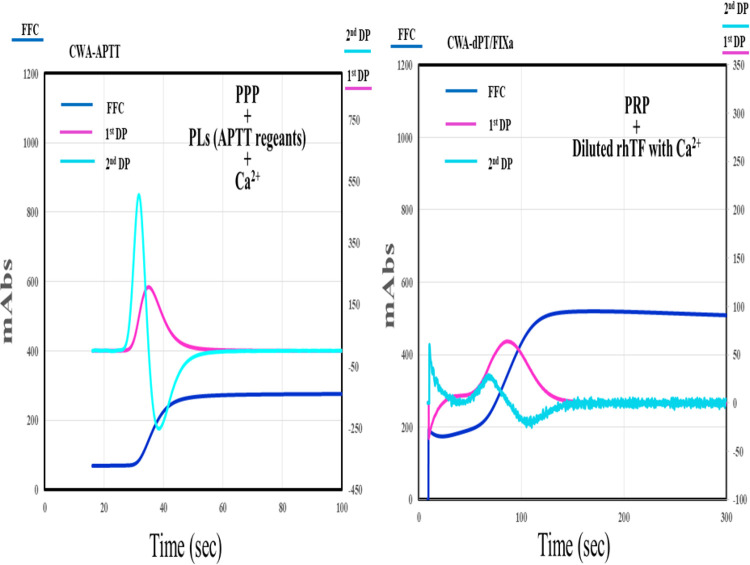
Figure 1.
A clot waveform analysis of APTT and sTF/FIXa in healthy volunteers. CWA indicates clot waveform analysis; sTF/FIXa, small amount of tissue factor induced FIX activation; APTT, activated partial thromboplastin time; PRP, platelet rich plasma; PPP, platelet poor plasma; navy blue line, fibrin formation curve; pink line, 1st derivative curve; light blue line, 2nd derivative curve; PLs, phospholipids; rhTF, recombinant human tissue factor.

