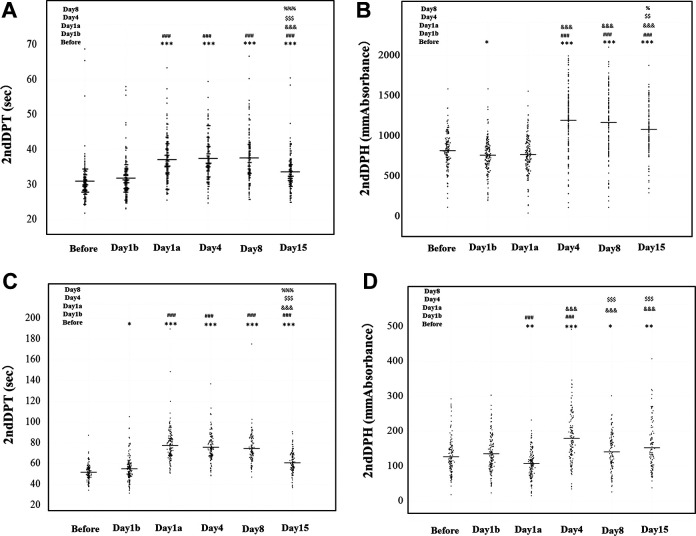
Figure 3.
A clot waveform analysis for APTT or sTF/FIXa: (A) 2nd derivative peak time (DPT) of APTT; (B) 2nd derivative peak height (DPH) of APTT; (C) 2nd DPT of sTF/FIXa; (D) 2nd DPH of sTF/FIX. ***, ###, &&&, $$$, %%% P < 0.001; **, ##, &&, $$, %% P < 0.01; *, #, &, $, % P < 0.05. APTT indicates activated partial thromboplastin time; sTF/FIXa, small amount of tissue factor induced FIX activation.

