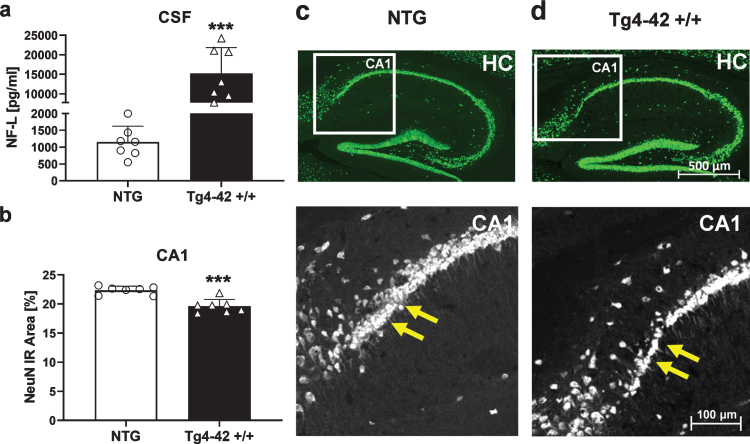
Fig. 8.
Quantification of neurons in the hippocampus of 9-month-old Tg4-42 +/+ mice. a) Murine neurofilament light chain levels (NF-L) in CSF samples as pg/ml. b) NeuN expression levels labeling neurons in the proximal CA1 region of the hippocampus as immunoreactive (IR) area in percent. a, b) n = 7 per group. Mean + SEM. Unpaired t-test. ***p < 0.001. c, d) Representative images of NeuN labeling in hippocampus samples of 9-month-old Tg4-42 +/+ and non-transgenic mice (NTG). Yellow arrows indicate region of neuronal loss.

