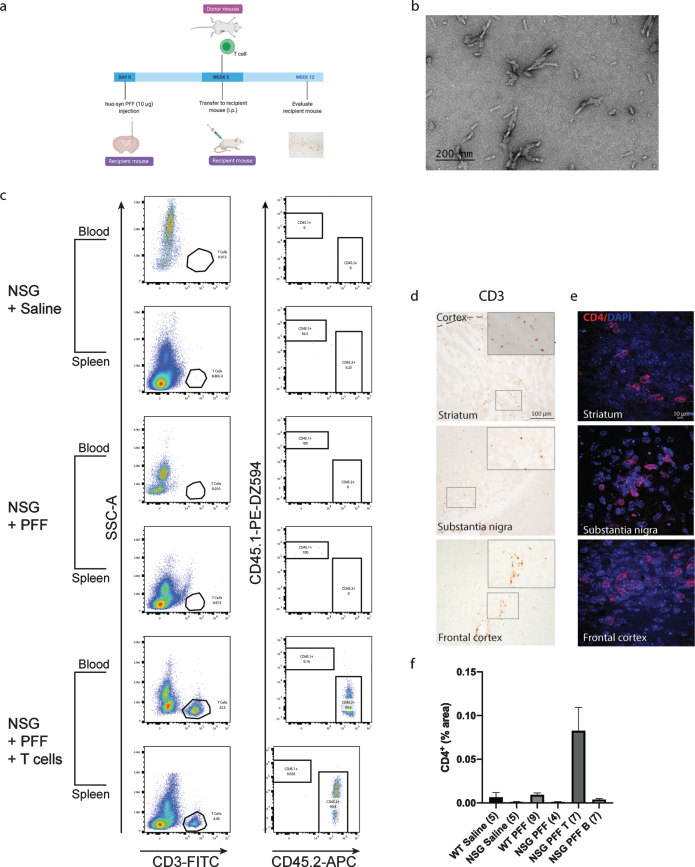
Fig. 1.
T cells in the blood, spleen and brain following adoptive transfer. a) Timeline of the experiment. b) PFFs were sonicated and validated by transmission electron microscopy. c) Flow cytometric analysis. Wildtype mice contained populations of T and B cells that are CD45.2 positive. NSG mice did not contain T and B cell populations. Following adoptive transfer of T cells to NSG mice, CD45.2+ CD3+ T cells were detected. Representative plots are shown for each treatment condition. d) Representative images from the mouse striatum, substantia nigra and frontal cortex staining positive for CD3+T cells in mice that received adoptive transfer of T cells. e) Immunofluorescent staining for CD4+ T cells in the striatum, substantia nigra and frontal cortex. f) Percentage area of tissue that is positive for CD4 signal in striatum, substantia nigra and frontal cortex combined. Scale bar: 500μm and 10μm. Schematic created with BioRender.com.

