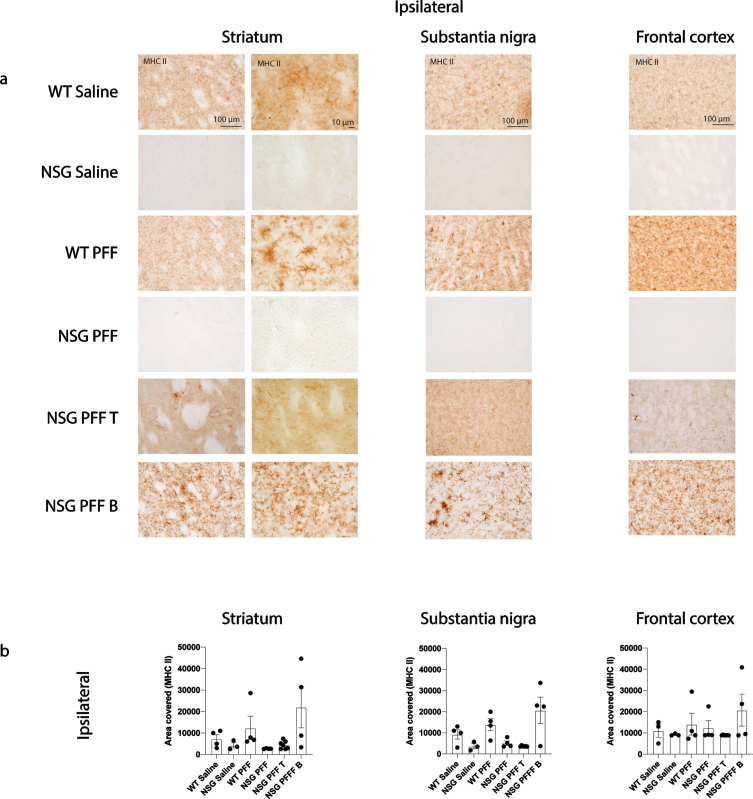
Fig. 5.
MHC II in the brain of α-syn PFFs injected mice. a) Representative images of MHC II immunoreactive cells in the ipsilateral striatum, substantia nigra and frontal cortex of saline and PFFs injected mice. High magnification examples of MHC II immunoreactive microglia in the striatum. b) Densitometry of 3–7 mice per group to determine MHCII levels in the ipsilateral striatum, substantia nigra and frontal cortex. Wildtype Saline, n = 3; NSG Saline n = 3, wildtype PFFs, n = 4; NSG PFFs, n = 4; NSG PFF T n = 7; PFF B n = 4). Statistical analyses were performed by Kruskal-Wallis test. *p < 0.05, **p < 0.01, ***p < 0.001. Scale bar: 100μm.

