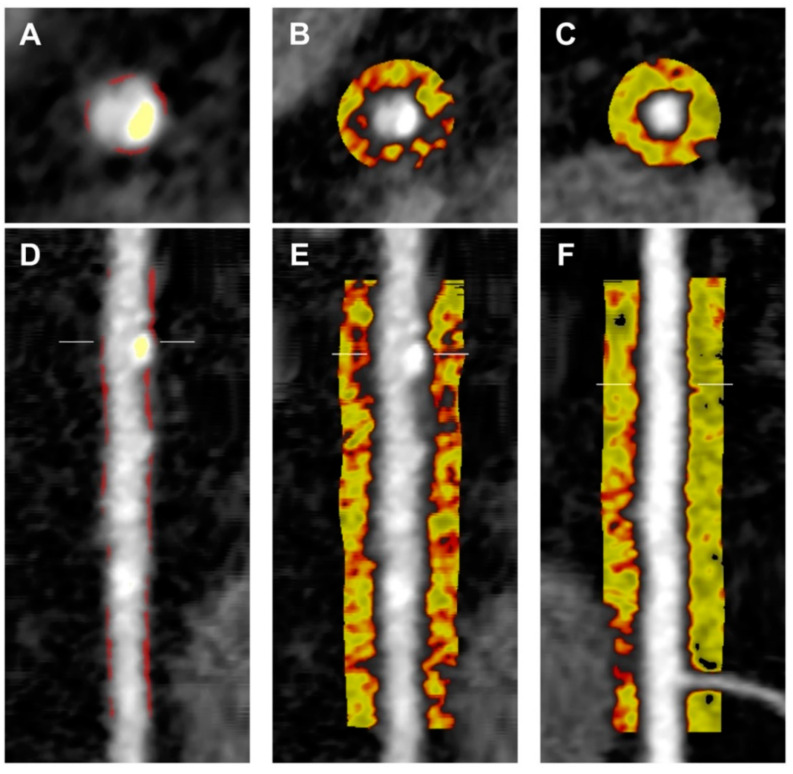
Figure 3.
Case comparison of per-patient PCAT quantification. Comparison of the RCA of a patient with HRP versus a patient without HRP (control) as shown on coronary CTA. RCA in patient with HRP shown in cross-sectional (A) and longitudinal (D) views, with calcified plaque (yellow) and non-calcified plaque (red) highlighted. Representation of PCAT attenuation of patient with HRP (−75.6 HU) and control (−93.9 HU) shown in cross-sectional (B,C) and longitudinal (E,F) views. Colour map corresponds to CT attenuation in Hounsfield Units (HU) ranging from −190 HU (yellow) to −30 HU (red). Cross-sectional view in patient with HRP shown in panel (B) versus control shown in panel (C). Longitudinal view in patient with HRP shown in panel (E) versus control shown in panel (F). RCA: right coronary artery.

