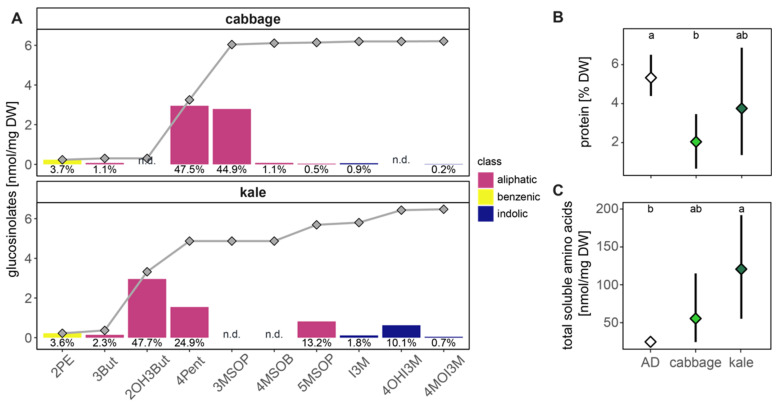
Figure 1.
Glucosinolate (A), protein (B) and soluble amino acid content (C) of the food plants and artificial diet (AD). (A) Absolute amounts of single glucosinolates [nmol/mg DW] detected in cabbage (n = 6) and kale (n = 5) are plotted as bars, the colour refers to the class of the glucosinolate: benzenic, aliphatic or indolic. The contribution of that structure to the total glucosinolate amount is printed as percentage below the corresponding bar. The dots represent the accumulated means of glucosinolates. (B) Soluble protein [% DW] of the diets (p = 0.031) and (C) total soluble amino acids [nmol/mg DW] (p = 0.011) plotted as mean ± 95% confidence interval. Tukey letter denoted a statistical difference of 0.05. Mean, standard deviations and statistical details for all analytes are in Table S1. AD = artificial, diet, DW = dry weight, n.d = not detected; glucosinolate side chains: 2PE = 2-phenylethyl, 3But = 3-butenyl, 2OH3But = 2-hydroxy-3-butenyl, 4Pent = 4-pentenyl, 3MSOP = 3-(methylsulfinyl)propyl, 4MSOB = 4-(methylsulfinyl)butyl, 5MSOP = 5-(methylsulfinyl)pentyl, I3M = indol-3-ylmethyl, 4OHI3M = 4-hydroxy-indol-3-ylmethyl, 4MOI3M = 4-methoxyindol-3-ylmethyl.

