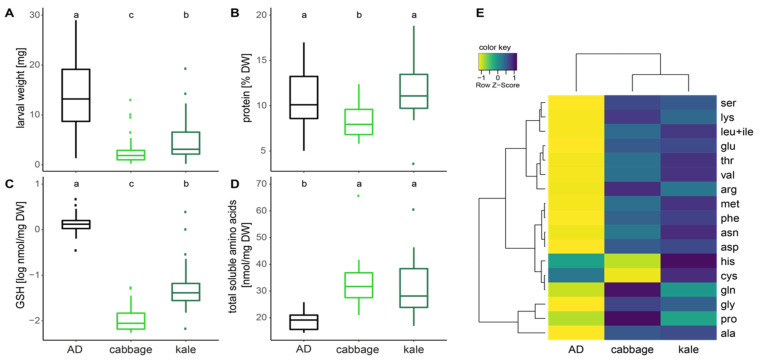
Figure 2.
Larval weight and body nutritional composition when fed on artificial diet and food plants with different GSL contents. (A) Larval fresh weight at 4–5 days (III instar) in mg (p < 0.001, n = 80–152); Figure S2 depicts the corresponding values for dry weight. (B) Protein in % of dry weight (p = 0.001, n = 20); (C) GSH concentrations in log of nmol/mg dry weight (p < 0.001, n = 20); (D) Total soluble amino acids in nmol/mg dry weight (p < 0.001, n = 20); (E) Heatmap of the mean [nmol/mg DW] of detected soluble amino acids, with yellow to green corresponding to small values and green-blue to dark blue to high values. Data were scaled across rows, comparing amounts of these amino acids between diet treatment groups. Statistical differences for A-D were assessed using a nested ANOVA mixed affect model, letters denote statistical difference at p = 0.05 level tested with Tukey post hoc test. Means, standard deviations and statistical details for A-D and individual amino acids (E) are in Table S2. AD, artificial diet; DW, dry weight; ▪ indicate outliers in the box-and-whiskers plots.

