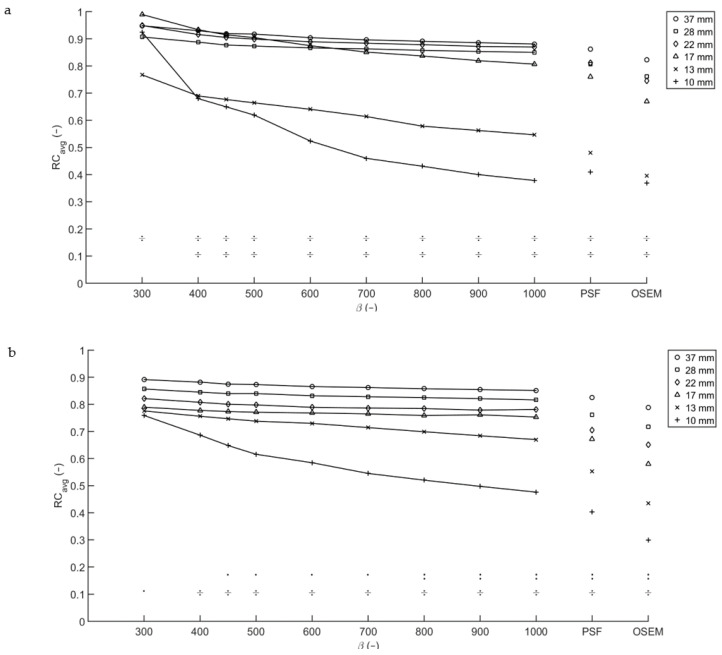
Figure 2.
Recovery coefficients from the Image Quality phantom for multiple T/B ratios. RCavg for T/B ratio 10:1 (a) and 20:1 (b), with acquisition time per bed position of 2 min. The symbols in the lower part of both graphs denote the significance of the differences between the 13 mm sphere and the four biggest spheres (upper row) and the 10 mm sphere and the four biggest spheres (lower row). An obelus (÷) corresponds to p < 0.001, a colon to p < 0.01 and a single dot to p < 0.05.

