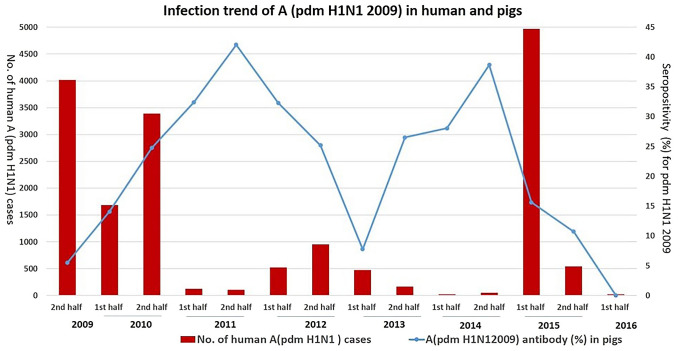
Fig. 2.
Distribution of percentage of serum samples positive for influenza A (pdm H1N1 2009) antibodies and number of human cases reported. Right Y axis represents the percentage of swine serum samples seropositive for influenza A (pdm H1N1 2009) and left Y axis represents the number of human cases reported. [Source: Global Influenza Surveillance and Response System, World Health Organization (WHO)]

