
Figure 2. Transcriptional Profiling of Circulating Mononuclear Cells.
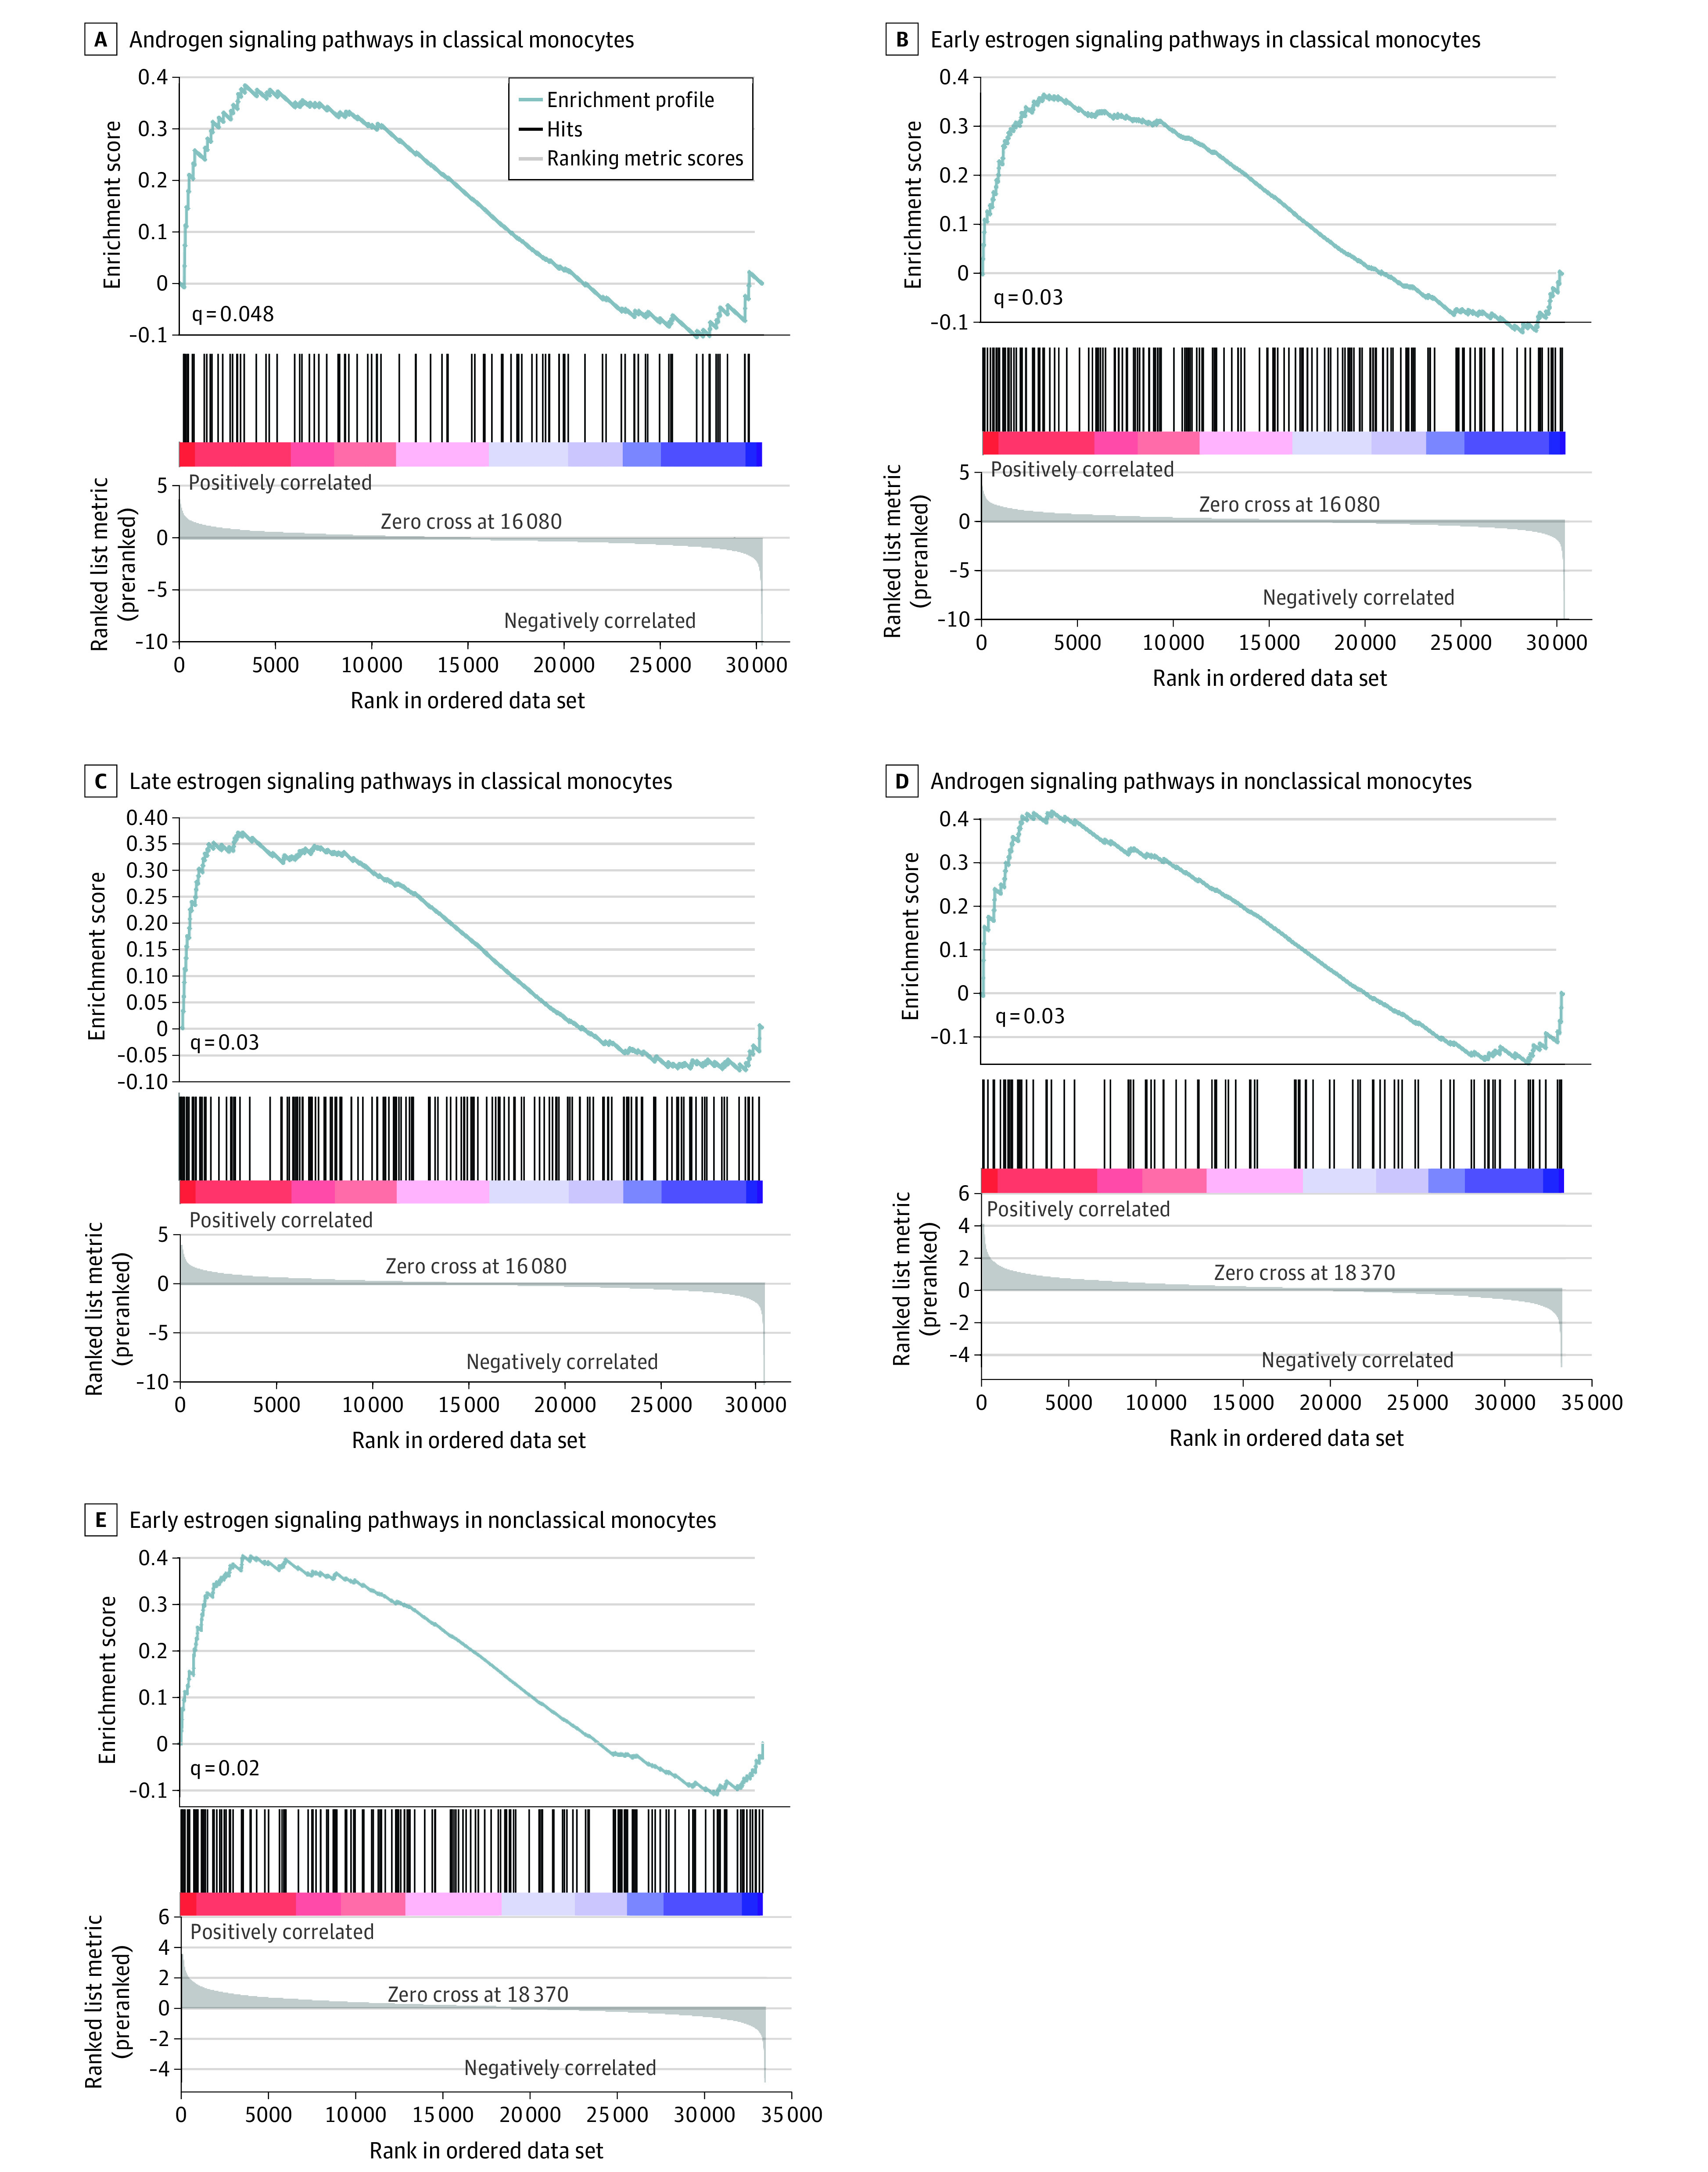
Gene set enrichment analyses were conducted on RNA sequencing data sets from sorted cells based on CD14 and CD16 expression from 7 men with COVID-19 requiring intensive care unit treatment vs 5 men with mild disease. The x axes indicate ranked gene lists (genes are ranked by the sign of the fold change × the −log 10 of the P value); colors on the y axes, heat maps of the genes in the gene set (the range of colors [ie, red, pink, light blue, and dark blue] shows the range of the ranking metric [ie, high, moderate, low, and lowest]).