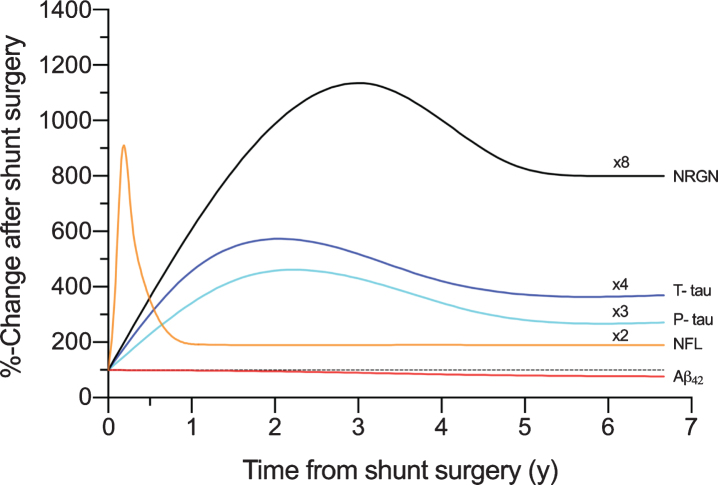
Fig. 7.
The schematic presentation of the temporal dynamics in biomarkers of neurodegeneration plotted with the time in years (y) from shunt surgery and percentual change from the pre-surgery values (100%). The plots are formed with local polynomial regression and based on the data shown in Supplementary Figure 1A-E. Multipliers added to figure, are highlighting the longitudinal elevation found for biomarkers. Aβ42, Amyloid-β 42; T-tau, total tau; P-tau, tau phosphorylated at threonine 181; NFL, neurofilament light; NRGN, neurogranin.

