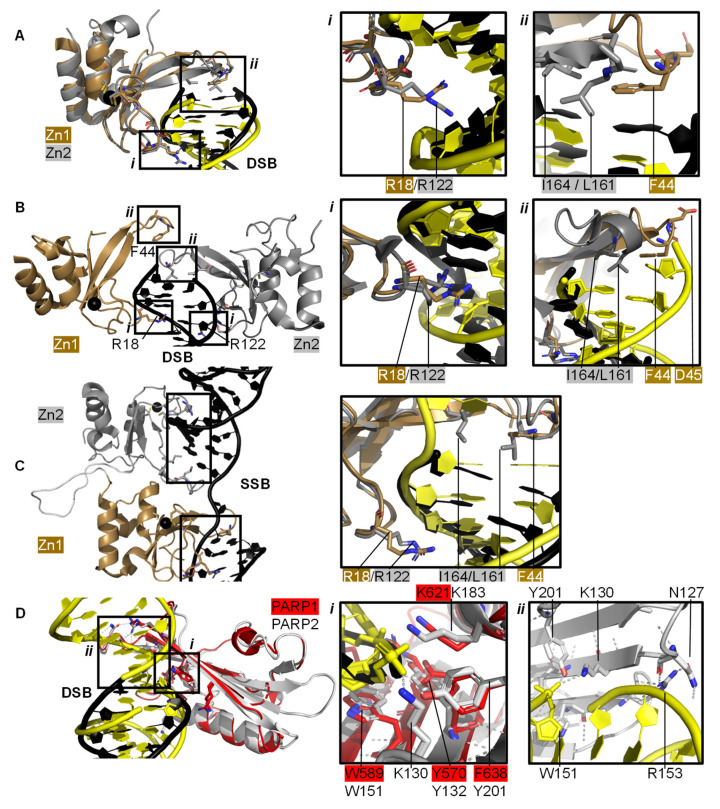
Figure 2.
PARP domains in complex with a DNA DSB model (A,B), SSB (C), or DSB (D). (A) Superposed crystal structures of Zn fingers 1 (Zn1, brown, PDB 3ODA [86]) and 2 (Zn2, silver, PDB 3ODC [86]), RMSD 0.96 Å, in complex with DSB models shown in black for Zn1 and yellow for Zn2. Inset i shows the phosphate backbone grip and inset ii the base stacking loop; (B) Zn1 (brown) and Zn2 (silver) cooperate DSB model binding (PDB 4AV1 [87]). Insets show the superposition of Zn1 and Zn2 with an RMSD of 0.80 Å of the boxed regions. In the superposition, Zn1 and Zn2 binding to a DSB model is shown in black and yellow, respectively, where i shows the Zn finger loop with R18/R122 interacting with the major groove of the DSB model and ii the base stacking loop with F44/L161/I164; (C) Zn1 and Zn2 also cooperate SSB binding (PDB 2N8A [89]). Inset shows the superposition of the boxed regions in Zn1 and Zn2 on a SSB with an RMSD of 0.83 Å, where DNA in yellow binds to Zn1 and DNA in black binds to Zn2; (D) Superposition of the WGR domains from PARP1 (red, PDB 4DQY [34]) on a black DSB model and PARP2 (white, PDB 6F5B [90]) bridging a yellow DSB with a 5′ phosphate group (Cα RMSD of 0.89 Å). Inset i highlights the superposed WGR PARP1 and PARP2 residues involved in DNA binding. Inset ii shows how the WGR of PARP2 interacts with the second DSB using R153.

