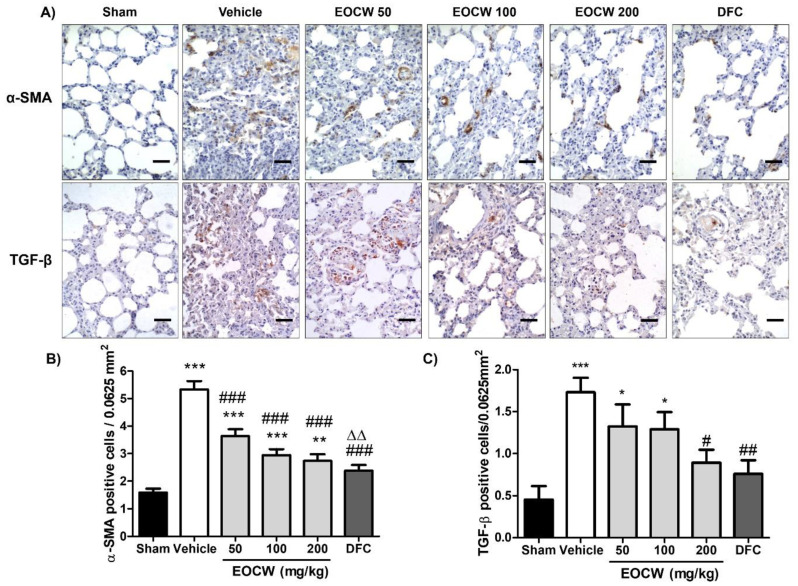
Figure 4.
(A) Cytoplasmic positivity pattern of immunohistochemical expression of α-SMA and TGF-β in group Sham and subjected to bleomycin-induced pulmonary fibrosis (Masson’s trichrome, 400×). (B) Assessment of the immunohistochemical expression of α-SMA and (C) TGF-β in the pulmonary tissue of the experimental groups. Significant differences compared to group Sham are expressed as * p < 0.05, ** p < 0.01 and *** p < 0.001; compared to group Vehicle are expressed as # p < 0.05, ## p < 0.01 and ### p < 0.001; compared to EOCW50 are expressed as ΔΔ p < 0.01 (ANOVA and Tukey’s multiple comparisons test).

