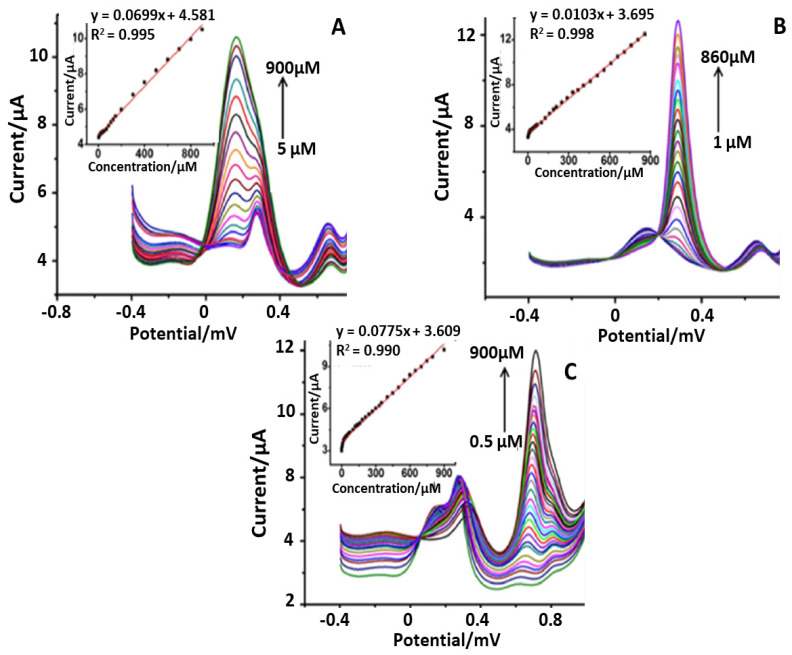
Figure 3.
SWVs obtained for various concentrations of UA (5 to 500 μM) (A) and FA (1 to 800 μM) (B) at Mn SnO2/GCE in the presence of 200 μM AA in 0.1 M PBS (pH 6.0) and inreal samples (C). (insert of A–C): plots of the oxidation peak currents as a function of various concentrations of UA and FA, respectively [51].

