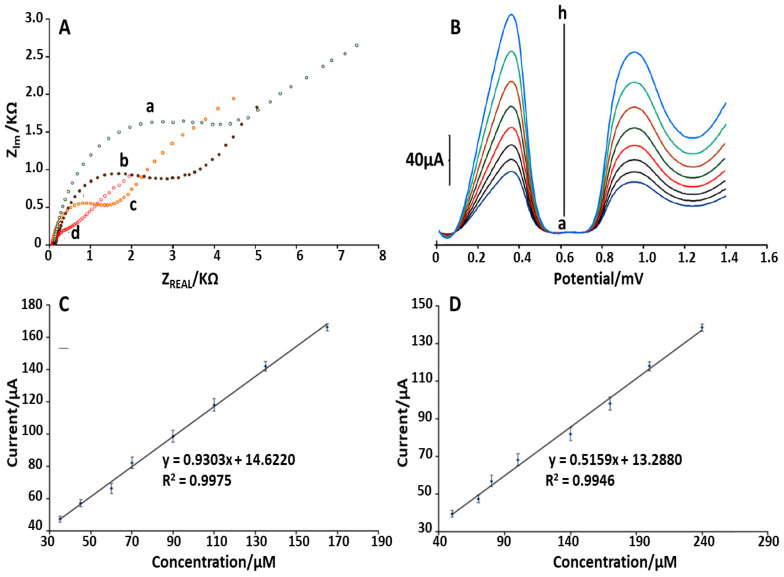
Figure 6.
(A): Nyquist diagrams of (a) CPE, (b) FeNi3/rGO/CPE, (c) HMPF6/CPE and (d) FeNi3/rGO/HMPF6/CPE in 1.0 mM [Fe(CN)6]3−,4−. (B): SW voltammograms of solution containing TBHQ and FA at the FeNi3/rGO/HMPF6/CPE; (a) 35.0 + 50.0; (b) 45.0 + 70.0; (c) 60.0 + 80.0; (d) 70.0 + 100.0; (e) 90.0 + 140.0; (f) 110.0 + 170.0; (g) 135.0 + 200.0 and (h) 165.0 + 240.0 μM. (C): The Ipa vs. TBHQ concentration obtained from SW voltammograms. (D): The Ipa vs. folic acid concentration obtained from SW voltammograms [54].

