Figure 1.
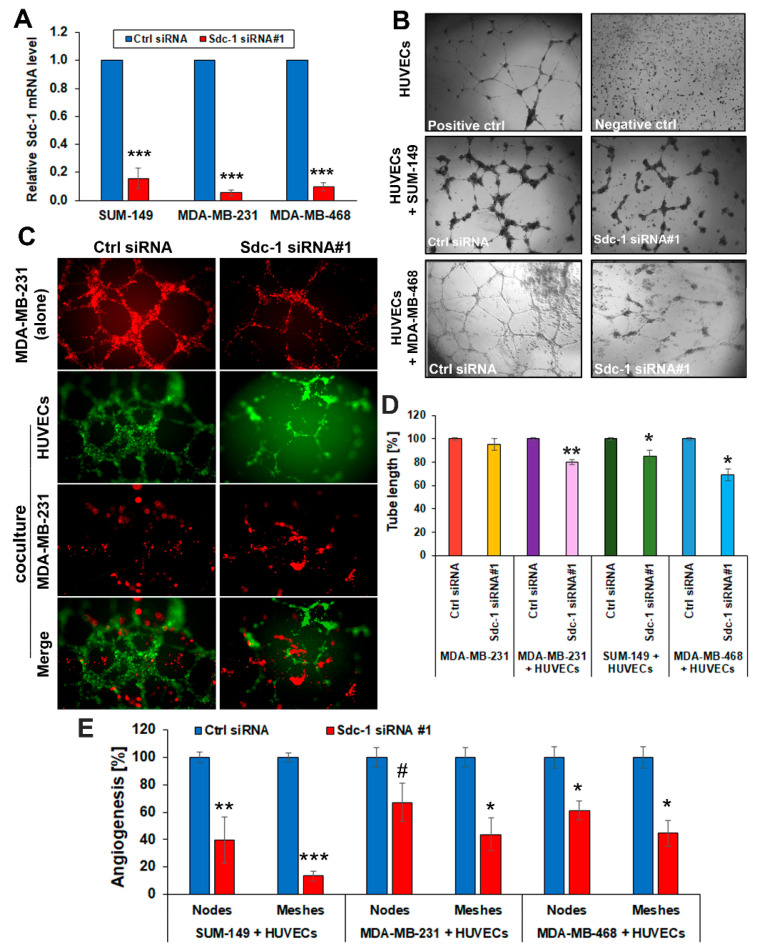
Sdc-1 depletion in TNBC cells restrains angiogenesis network formation of HUVECs. (A) Sdc-1 knockdown was confirmed by qPCR in the triple-negative cell lines SUM-149, MDA-MB-231, and MDA-MB-468. (B–E) 3D co-culture models of HUVECs and the control siRNA and Sdc-1 siRNA transfected SUM-149, MDA-MB-468, and MDA-MB-231 cells. (B) Phase-contrast images for HUVECs were either grown in 3D alone (as negative or positive controls) or co-cultured with control and Sdc-1-suppressed SUM-149 and MDA-MB-468 cells for 24 h. (C) Confocal immunofluorescence microscopy shows tubule formation by only HUVECs (green fluorescent staining) and not by MDA-MB-231 cells (red fluorescent staining) in a co-culture 3D system. Notably, MDA-MB-231 cells formed tubules when cultured alone in 3D on Matrigel. (D) Quantitative analysis of HUVEC tubulogenesis, namely the total length of HUVEC tubules. (E) Quantitative analysis of nodes and meshes formed by HUVECs as analyzed by angiogenesis analyzer software. Panels (A,D,E): Data represent the mean ± SEM, n = 3. *** p < 0.001, ** p < 0.01, * p < 0.05, and # p = 0.09 as determined by Student’s t-test.

