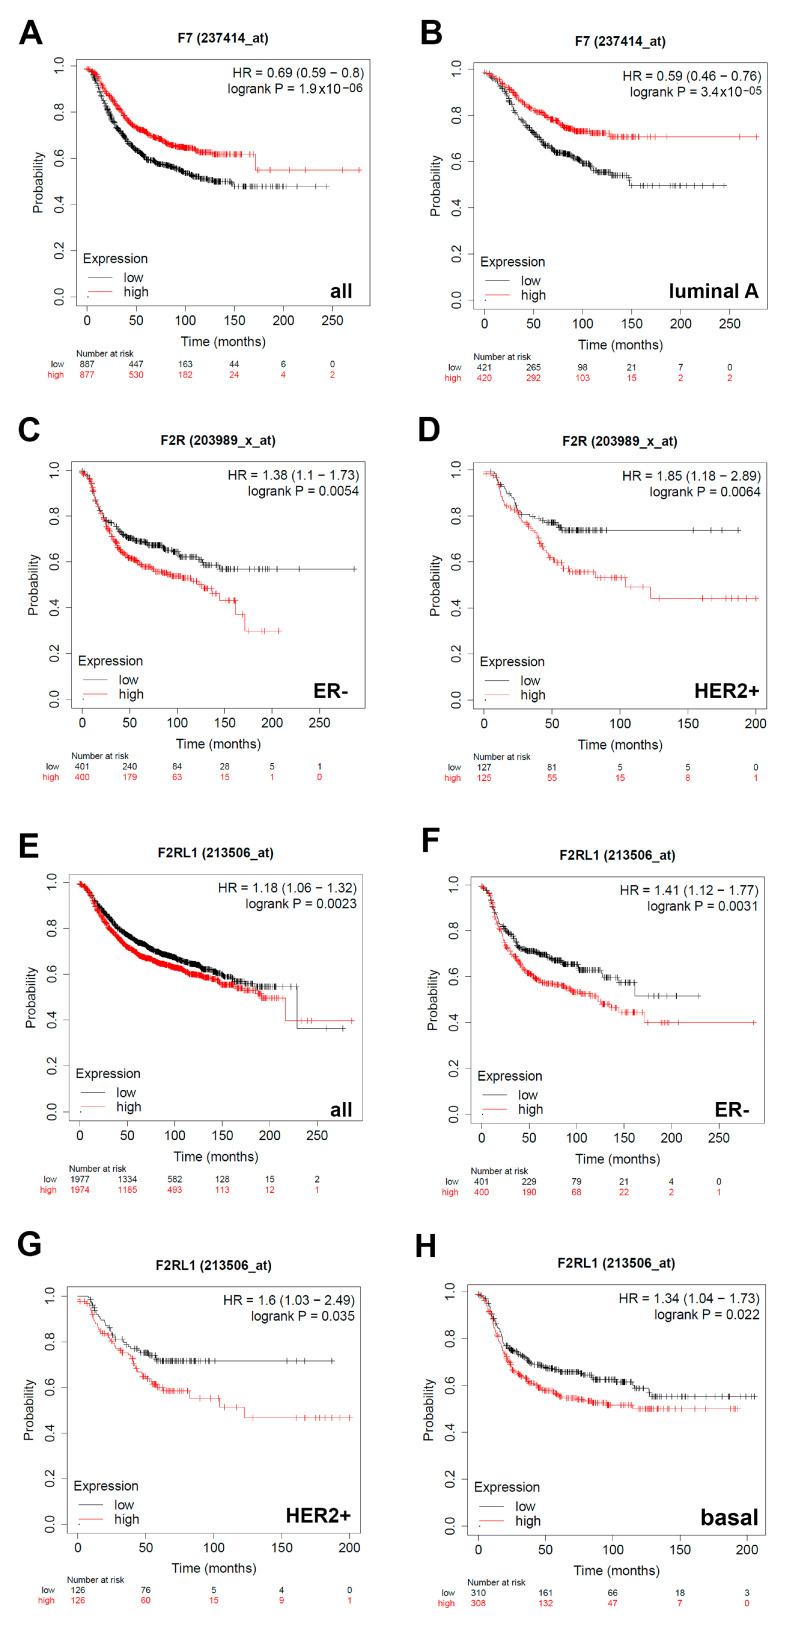
Figure 5.
The prognostic value of the expression of F7 (factor VII), F2R (PAR1), and F2RL1 (PAR2) in patients with breast cancer. Kaplan–Meier curves are plotted based on expression of F7 in (A) all patients showing F7 expression (n = 1734), and (B) patients with luminal A classification (n = 841). Expression of F2R in (C) ER-classified patients (n = 801) and (D) HER2 + classified patients (n = 252). Expression of F2RL1 in (E) all patients (n = 3951), (F) ER- classified patients (n = 801), (G) HER2 + classified patients (n = 252), and (H) patients with tumors of the basal subtype (n = 618). Curves were analyzed using the log-rank test. Log-rank p-values and hazard ratios (HRs; 95% confidence interval in parentheses) are shown. The corresponding Affymetrix IDs are: F7: 204363_at; F2R: 203989_x_at; F2RL1: 213506_at.

