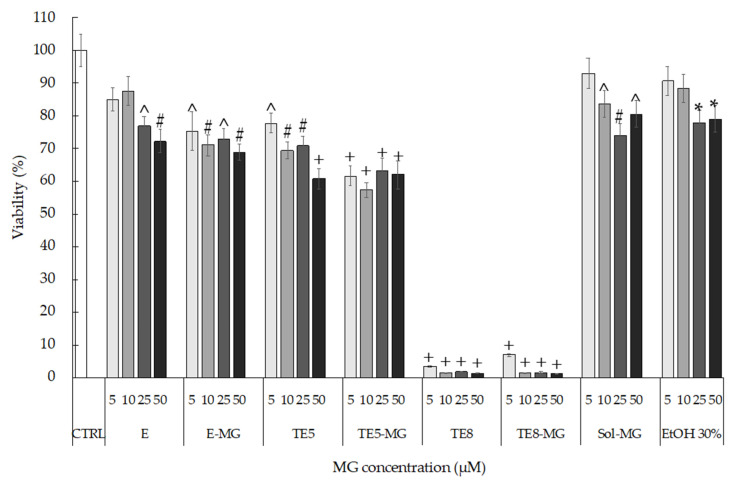
Figure 2.
HaCaT cell viability evaluated by MTT test after 24 h of treatment with E, TE5, and TE8 produced in the absence and presence of MG. MG ethanol solution (Sol-MG) and sole ethanol (EtOH) were tested as a control. Data are given as mean ± SD, representative of three independent experiments with at least three technical replicates each time. * p < 0.05, ^ p < 0.01, # p < 0.001, + p < 0.0001 vs. CTRL sample by ANOVA.

