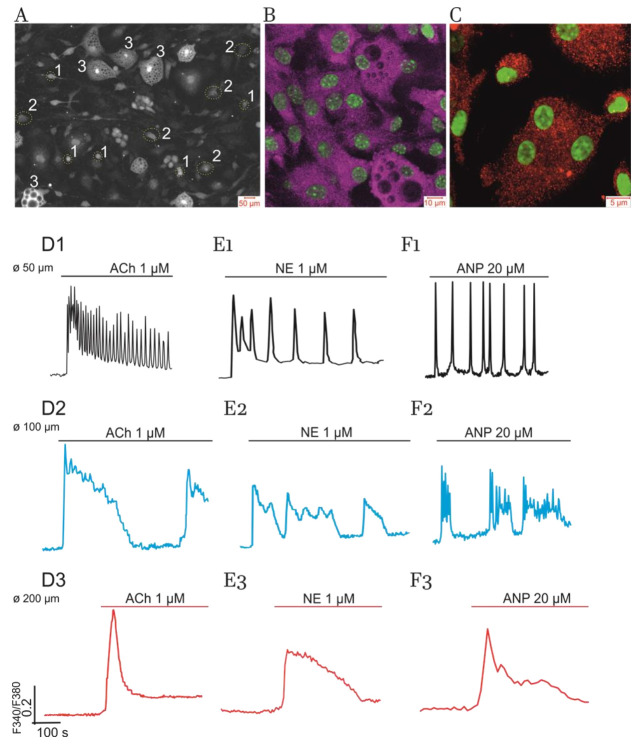
Figure 1.
Primary culture of adipocytes derived from eWAT of control mice, expression of ER Ca2+-signaling receptors, and Ca2+-responses evoked by ACh, NE, and ANP. (A) Mature cultured adipocytes (9 DIV) may be separated into three types of cells, based on their size (Ø): 1—cells with small lipid inclusions having diameter Ø ≥ 50 µm and occupying 10–15% of all cells; 2—50% to 60% adipocytes having several lipid droplets and intermediate size of Ø ≥ 100 µm; 3—the cells (15–20%) completely filled with lipids (i.e., hypertrophied “obese” cells) having Ø ≥ 200 µM. Bright field microscopy. See Methods for details. Representative culture with number of the cells in dish (in the field of observation) N = 100–120. (B,C) Immunocytochemical staining with confocal microscopy characterizing distribution of the proteins of ER Ca2+-receptors: IP3R (subtypes 1 and 2) were visualized in violet at panel B; RyR (subtypes 2 and 3) were visualized in red at panel C. The nuclei were colored in green. See Methods for details. (D–F) Impact of cell size. The Ca2+-responses evoked by ACh (panels D1–D3), NE (panels E1–E3), and ANP (panels F1–F3) in cultured adipocytes (9 DIV). The traces shown in black (D1,E1,F1) characterize small-size cells (type 1). The responses of intermediate size adipocytes (type 2) are shown in blue. Red traces display the responses of hypertrophied “obese” cells (type 3). Here, representative traces of the changes in cytosolic [Ca2+]i (registered as Fura-2 340/380 ratio) are depicted. Number of experiments for each panel: n = 4 to 6. The number of the cells in each culture (in the field of registration): N = 100–120. Percentages (%) of the cells in culture responding in a similar way are indicated at respective traces.

