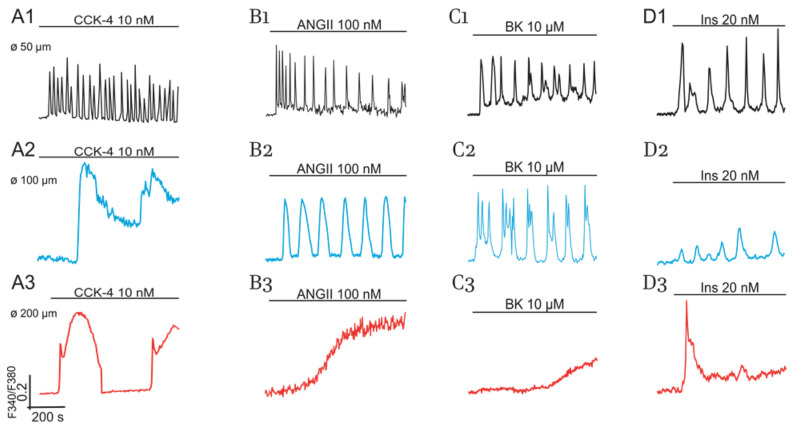
Figure 2.
Effects of CCK (A1–A3), AngII (B1–B3), BK (C1–C3), and Ins (D1–D3) on Ca2+- responses of cultured adipocytes (9 DIV) of control mice. Impact of cell size. Responses of small and intermediate size cells and of hypertrophied cells are indicated in black, blue, and red colors, respectively. All conditions of the experiments and abbreviations correspond to Figure 1.

