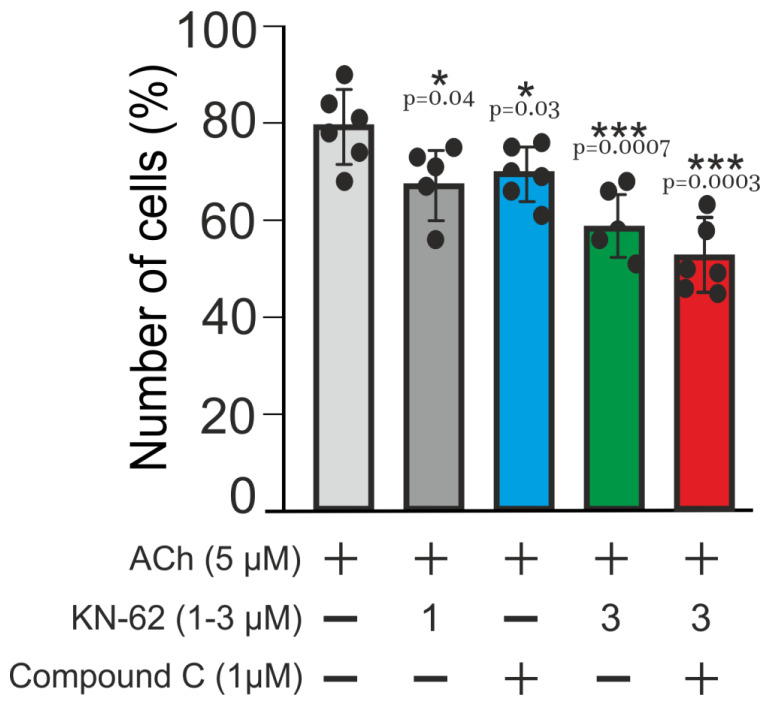
Figure 7.

Impact of CaMKII and AMPK on Ca2+-oscillations elicited by ACh in adipocytes and robustness of NOS-G. Bars represent average number of the cells, which respond to added ACh in control (black bar) and in the presence of the inhibitors of CaMKII (KN-63) and AMPK (Compound C). Concentrations of ACh and inhibitors are depicted in the figure. Sign + indicates the application of ACh or of the inhibitors. The inhibitors were added 10 min before the application of ACh. All conditions of the experiments and abbreviations correspond to Figure 1. Details are given in the text. For each column, the number of experiments n = 6. Data presented as mean ± SE.
