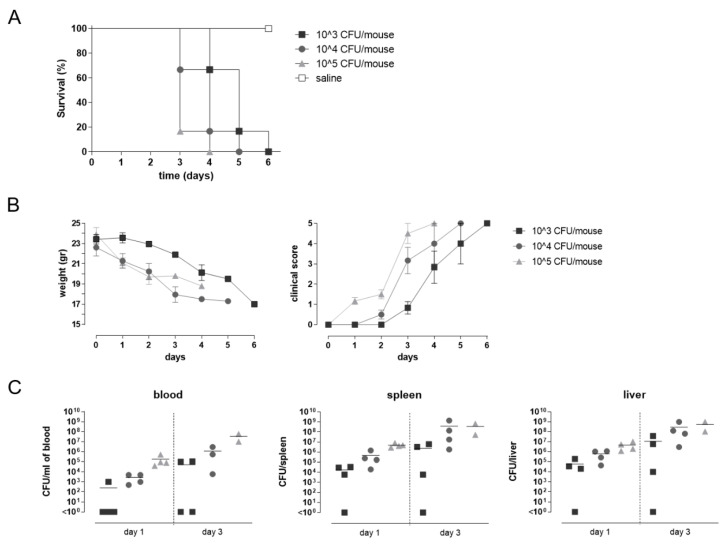
Figure 5.
Murine systemic challenge model. C57BL/6 mice were infected by the IV route with 103, 104 or 105 CFU/mouse of the virulent strain STm D23580. As control, a group received saline. (A) Kaplan-Meier curve of mouse survival. Results were expressed as percentage of survival over time using 6 mice for each group. (B) Evaluation of the animal body weight expressed in grams, and the clinical score analysis based on a scale for severity of disease, from 0 (normal) to 5 (moribund). Data are reported as mean value ± SEM for each time point using 6 mice for each group. (C) Bacterial load in blood, spleen and liver samples collected 1 or 3 days after infection. Values are reported as the number of CFU/mL of blood or CFU/organ of surviving mice for each group. Symbols represent individual mice and bars indicate the mean CFU for each infection dose.

