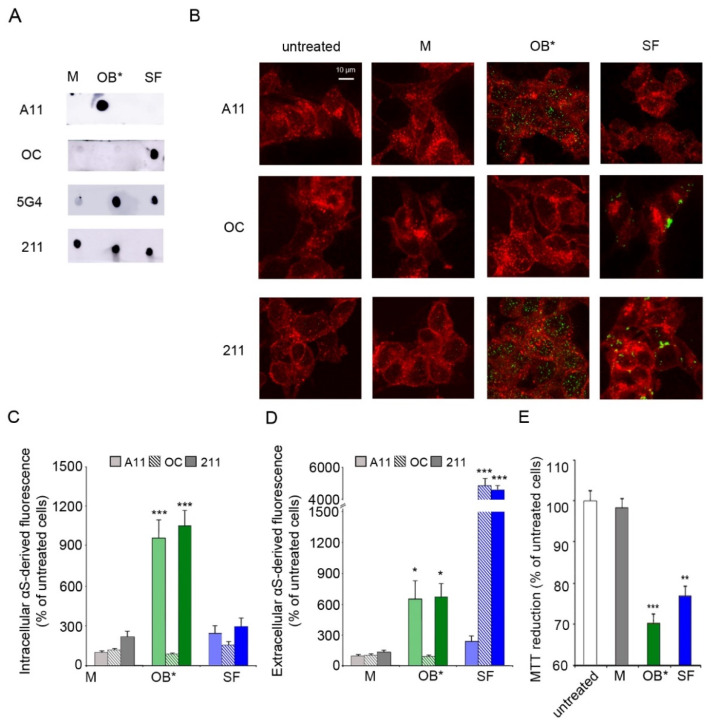
Figure 1.
(A) Dot-blot analysis of αS conformers labelled with conformation-sensitive antibodies A11, OC, and 5G4, and conformation-insensitive 211 antibodies specific for human αS. (B) Representative confocal images of SH-SY5Y cells exposed to αS species at 0.3 μM for 1 h. Red fluorescence shows the cell membranes revealed with wheat germ agglutinin. Green fluorescence indicates the αS species labelled with the indicated antibodies. (C,D) Histograms reporting the semi-quantitative analysis of intracellular (C) and extracellular (D) αS fluorescence expressed as the percentage observed in untreated cells, taken as 100%. (E) MTT reduction in SH-SY5Y cells exposed to αS species at 0.3 µM for 24 h. Error bars indicate S.E.M. The statistical analysis was made by one-way ANOVA followed by Bonferroni’s multiple comparison test relative to untreated cells (* p < 0.05, ** p < 0.01, *** p < 0.001).

