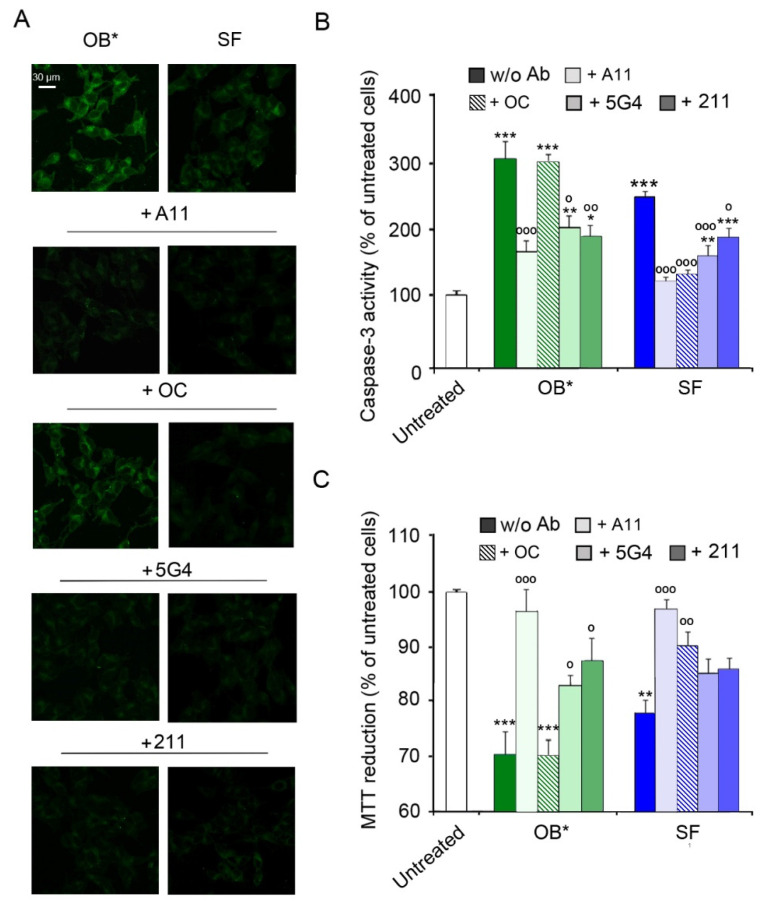
Figure 3.
(A) Representative confocal images showing caspase-3 activity in SH-SY5Y cells treated with αS aggregates at 0.3 µM and A11, OC, 5G4 and 211 antibodies (in a 1:2.5 molar ratio) for 24 h. (B) The histogram reports a semi-quantitative analysis of caspase-3 activity expressed as the percentage of untreated cells represented in Figure 2, taken as 100%. (C) MTT reduction in SH-SY5Y cells treated with αS aggregates (0.3 µM) and with A11, OC, 5G4 and 211 antibodies (in a 1:2.5 molar ratio) for 24 h. Error bars indicate S.E.M. The statistical analysis was made by one-way ANOVA followed by Bonferroni’s multiple comparison test relative to untreated cells (* p < 0.05, ** p < 0.01, *** p < 0.001), or to cells treated with the same αS species without antibodies (° p < 0.05, °° p < 0.01, and °°° p < 0.001).

