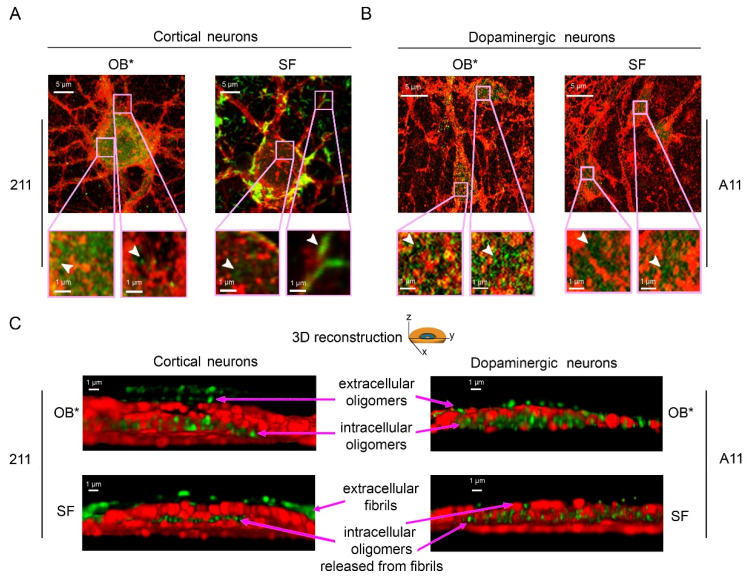
Figure 5.
Representative STED images of primary rat cortical neurons (A) and human iPSC-derived dopaminergic neurons (B) exposed to OB* and SF at 0.3 µM for 24 h. Red and green fluorescence indicates the cell membranes and the αS species labelled with wheat germ agglutinin and the conformation-insensitive human-specific anti-αS 211 antibodies, respectively, in (A), or by MAP-2 and the anti-oligomer A11 antibodies, respectively, in (B). The pink boxed areas show higher magnifications of the αS species. (C) 3D reconstructions of the z-stack analysis of the cells shown in panels A and B. Neurons were virtually dissected on the zy plane to show more clearly the extracellular (top) and intracellular (middle) αS species labelled with 211 (left images) and A11 antibodies (right images).

