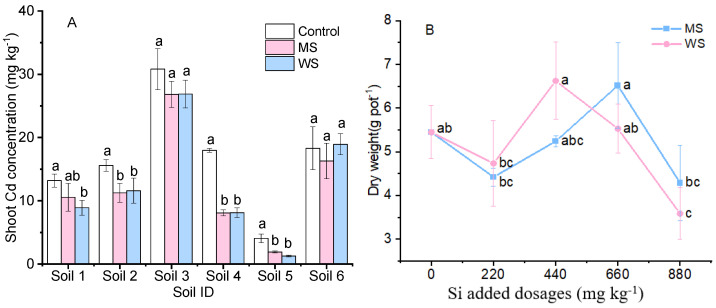
Figure 2.
Cd concentration of amaranth shoot in six Cd-contaminated soils under 440 mg·kg−1 Si treatments (A) and in soil 3 under 0, 220, 440, 660, and 880 mg·kg−1 added Si dosages (B). Control, non-amendment treatment; MS, 4A molecular sieve; WS, wollastonite. Data are means ± SE (n = 4). Different letters above the adjacent bars or lines denote a significant (p < 0.05) difference among the treatments in the same soil.

