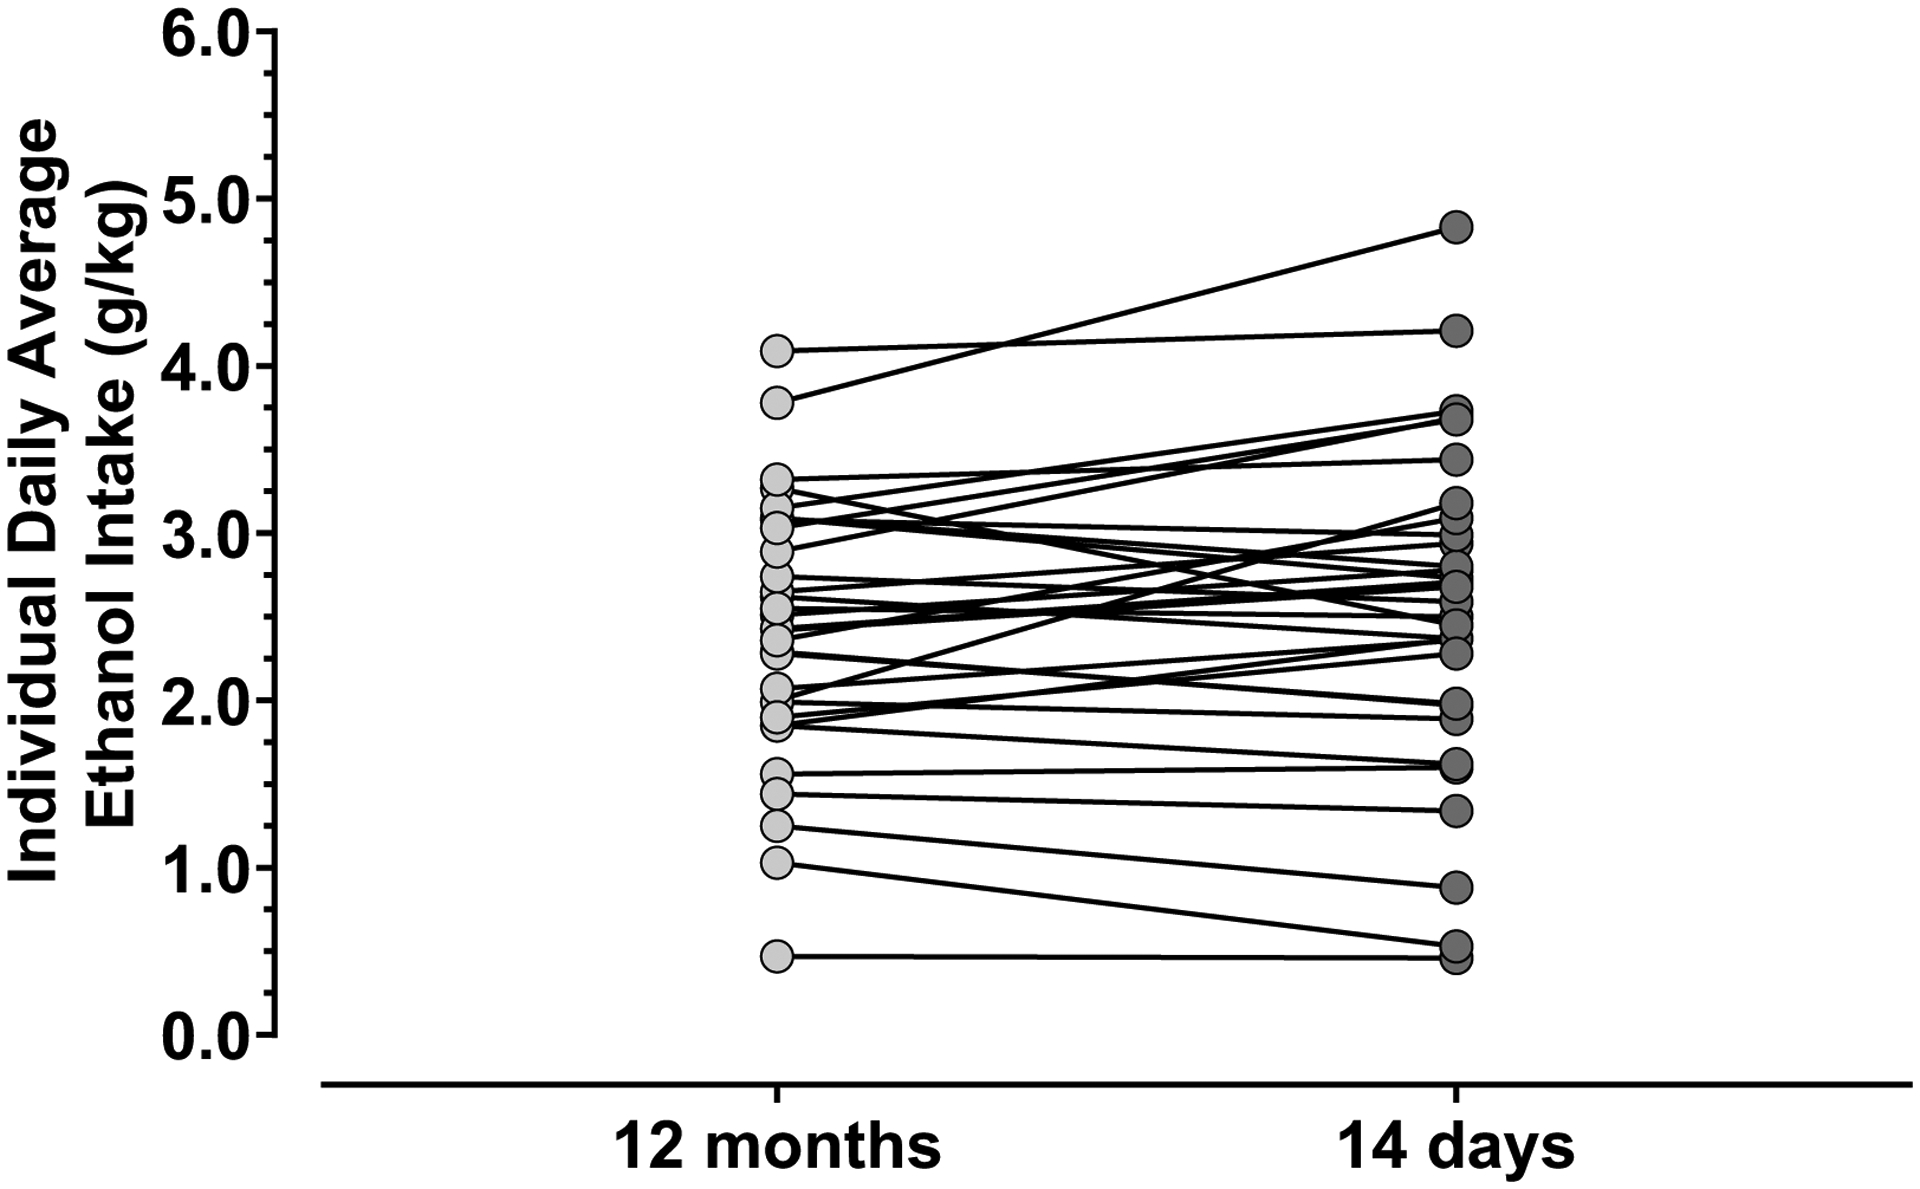
Fig 1: Ad-libitum Alcohol Consumption.

Average daily ethanol intake of each monkey (N = 31) is shown for the 12 months (light circles) of open-access drinking and the 14 days (dark circles) prior to PEth assessment. Each line between light and dark circles corresponds to the same monkey’s average ethanol consumed each day in both time periods. The average daily ethanol intake was similar between the 12-month and 14-day periods of evaluation. Statistical analysis performed with paired t-test. Ethanol-naïve controls were excluded in the graph.
