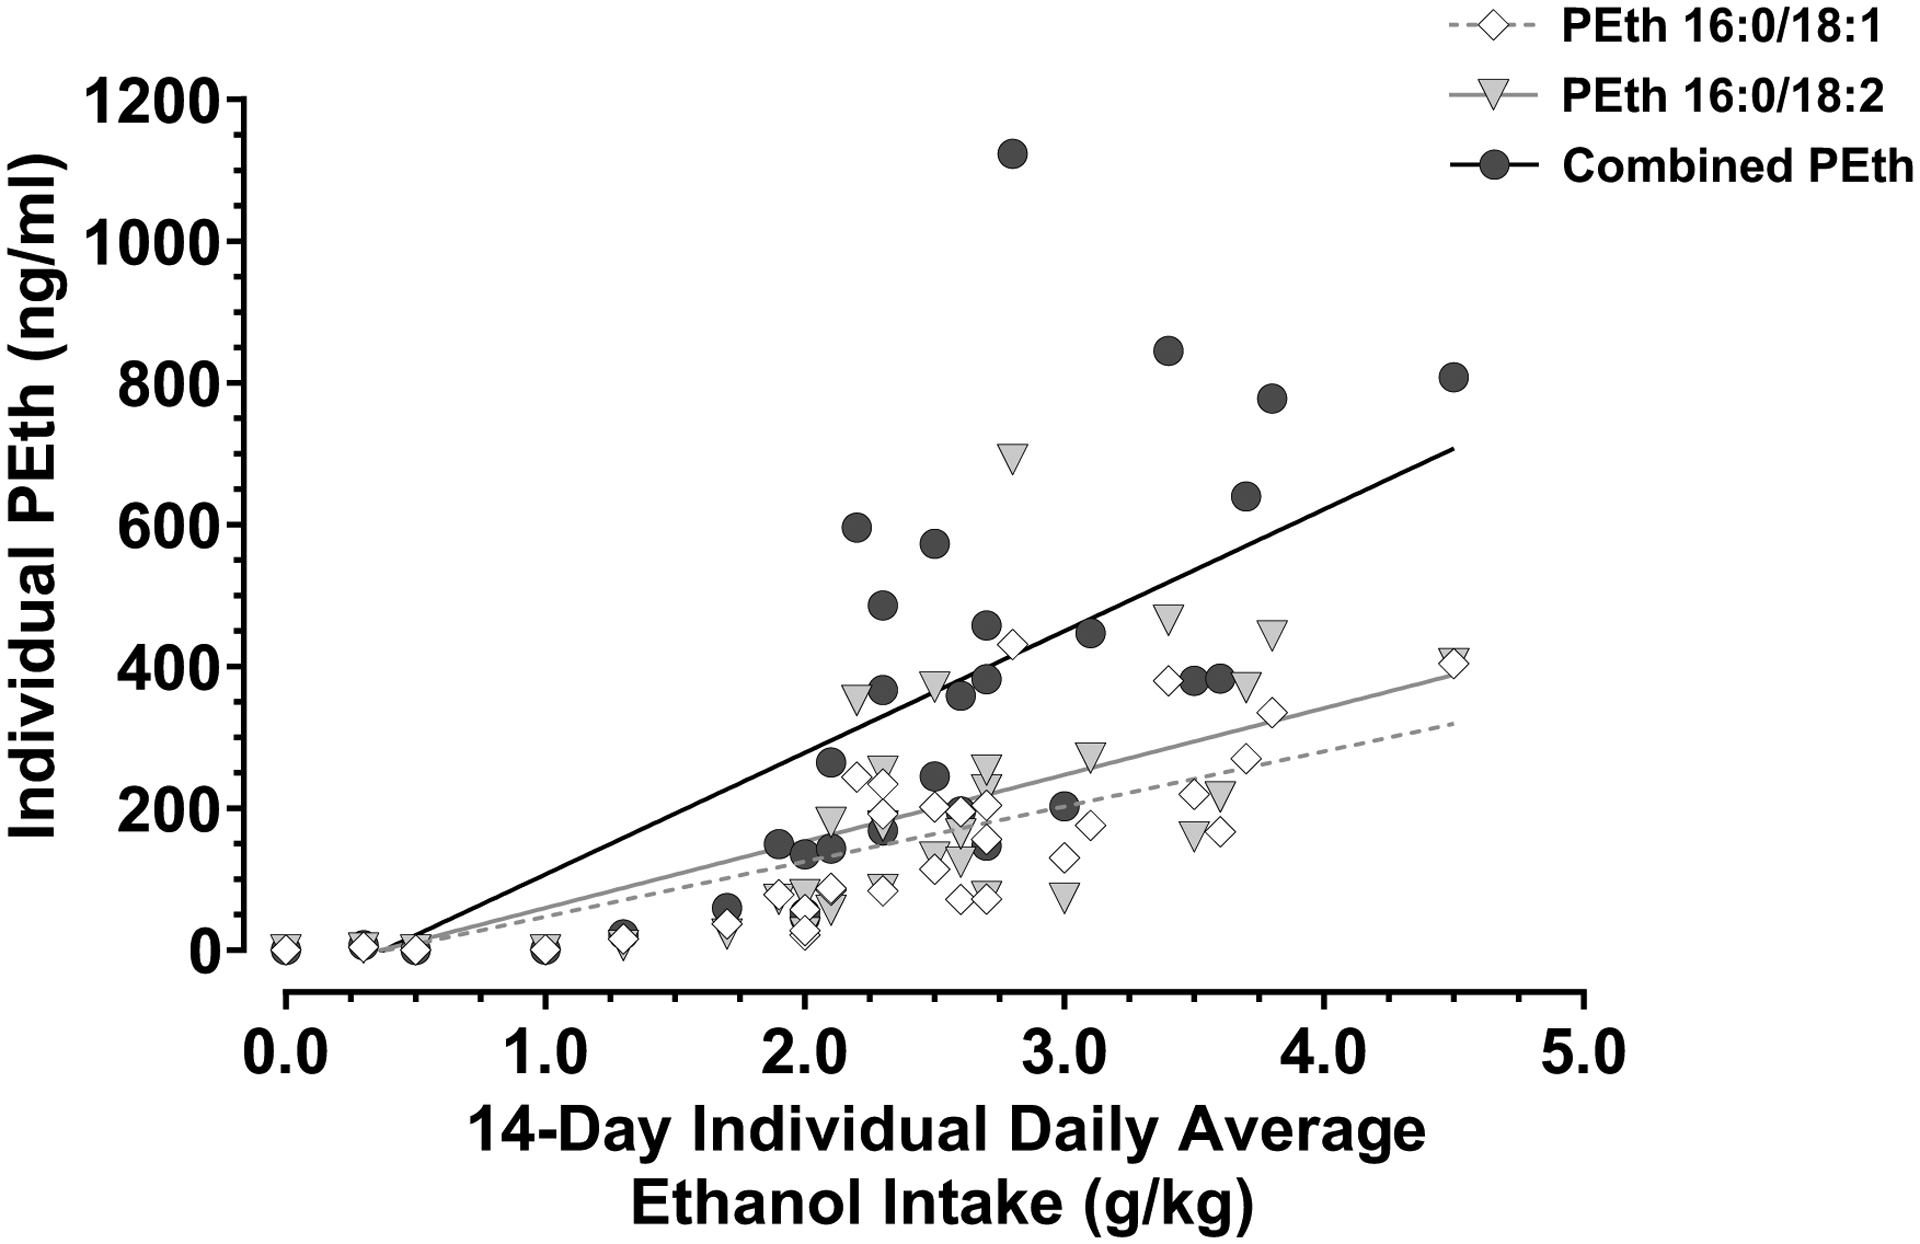
Fig. 2: Correlation Between Daily Average Ethanol Drinking and PEth Levels.

Individual PEth 16:0/18:1 (diamonds), PEth 16:0/18:2 (triangles) and combined PEth (circles) measures were analyzed against the individual daily average amount of ethanol consumed in the 14-day period before the blood draw. Pearson’s correlation analysis was performed. Ethanol-naïve controls (N = 8) were excluded from the statistical analysis, but they are shown in the graph at zero in the X and Y axes without being part of the best fit line. N = 31.
