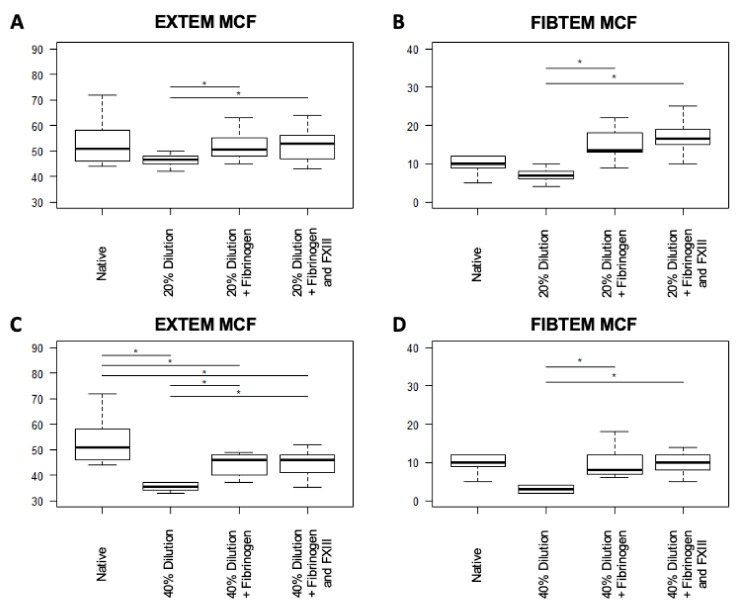
Figure 2.
Boxplot diagram showing the results of the administration of fibrinogen and combined fibrinogen/FXIII to samples that were diluted by 20% (A,B) and 40% (C,D), respectively. Significant differences are highlighted with an asterisk (*: p < 0.05). Abbreviations: CT = clotting time; CFT = clot formation time; LI60 = lysis index after 60 min; MCF = mean clot firmness.

