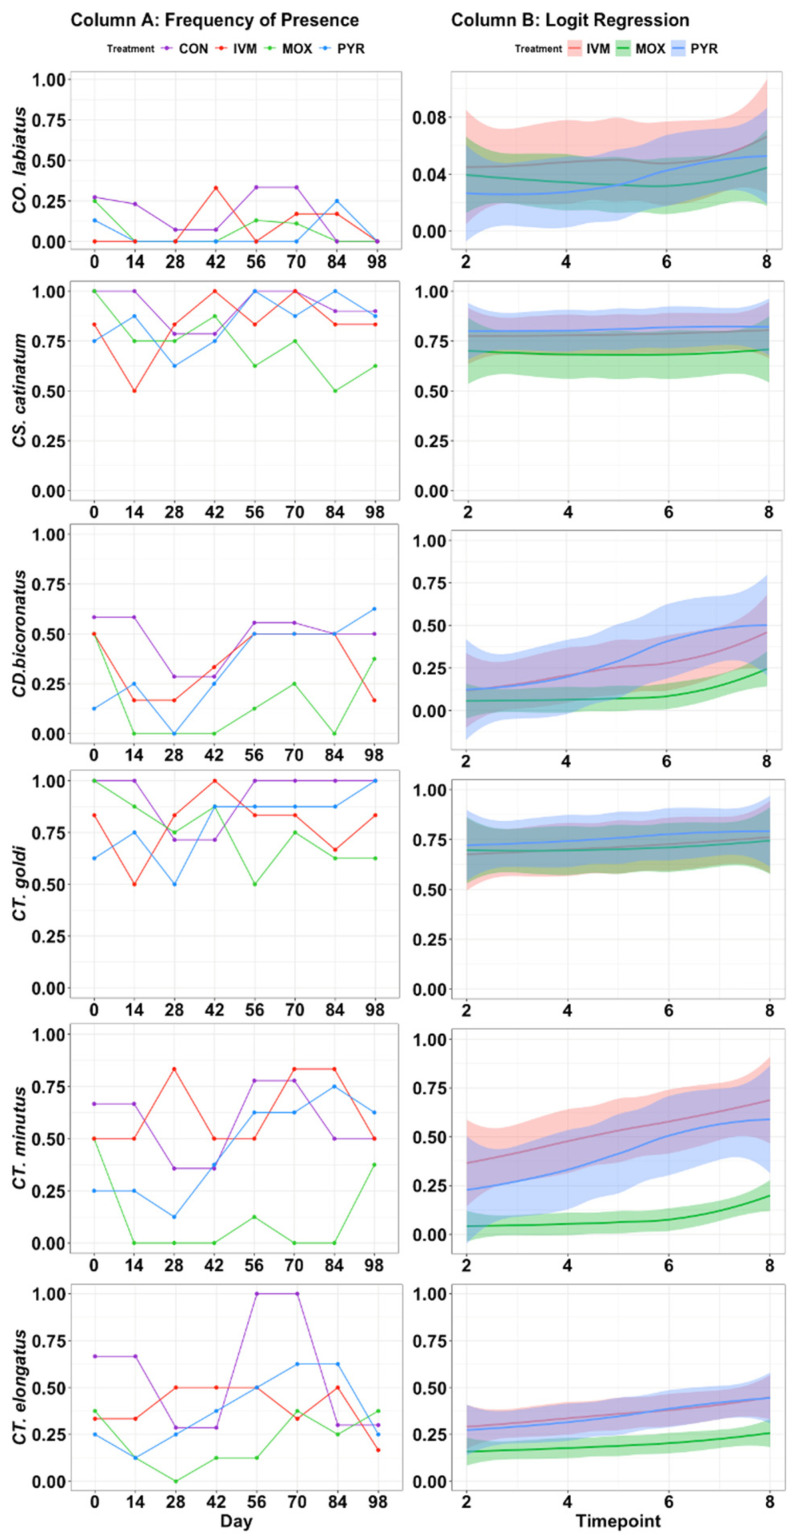
Figure 2.
Frequency of presence and logit regression models of the multidrug-resistant species presence in the study herd. Column A contains frequency of presence at each time point, and column B contains the binomial logistic regression predicted probability of presence plots based on CON samples. Timepoint 2 = Day 14, Timepoint 3 = Day 28, Timepoint 4 = Day 42, Timepoint 5 = Day 56, Timepoint 6 = Day 70, Timepoint 7 = Day 84, Timepoint 8 = Day 98. Shaded areas indicate 95% confidence intervals.

