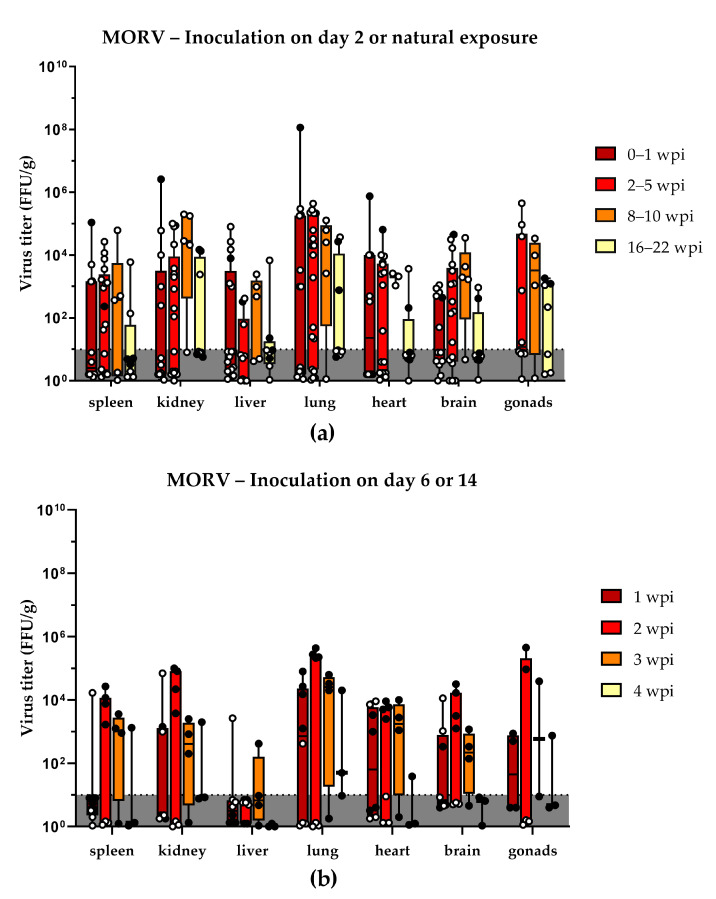
Figure 2.
Organ titers of MORV-infected animals: (a) virus titers of organs from Mastomys that have been infected via inoculation 2 days post-birth (black dots) or via natural contact with infected individuals (white dots); (b) virus titers of organs from animals that have been inoculated 6 days (black dots) or 14 days (white dots) post-birth. The different time points post-infection are shown in different colors, and all samples falling into this time frame have been pooled. The limit of detection is shown by the dotted line and dark grey coloration. Titers are shown as box and whisker plots with all data points shown. Virus titers of negative samples (below the limit of detection) appear to vary due to the differences in organ weight, which is taken into account for the virus titer per gram organ.

