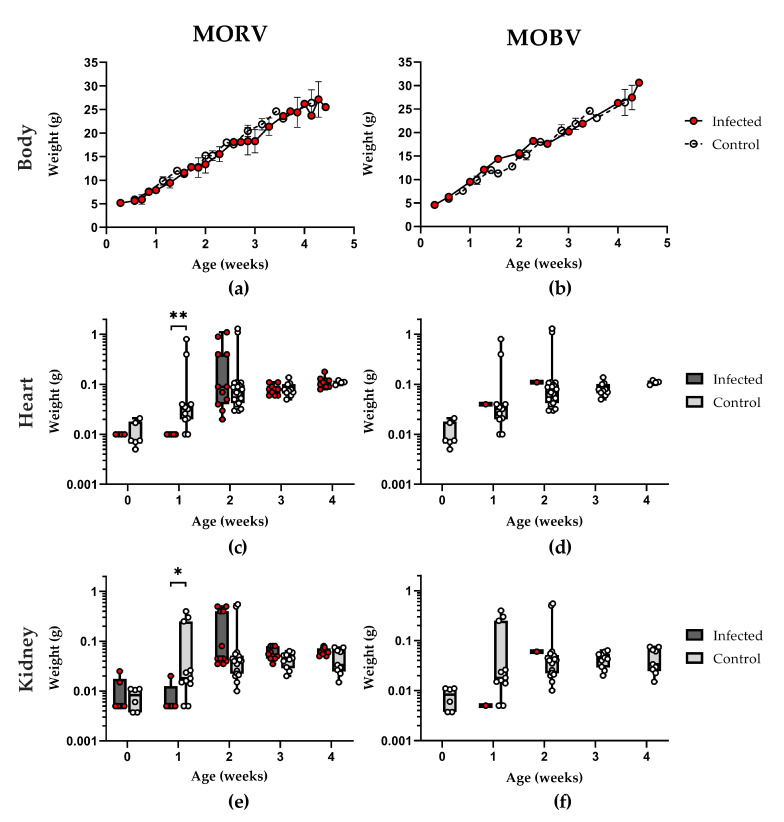
Figure 3.
Growth and development of infected Mastomys. Data for the MORV-infected animals (inoculated subcutaneously (s.c.) with 1000 focus forming units (FFU) on days 2, 6, and 14 as well as naturally exposed) are shown on the left, and data for the MOBV-infected animals (inoculated s.c. with 1000 FFU on day 2) are shown on the right. (a,b) Body weight, as well as organ weight for hearts (c,d) and kidneys (e,f) have been measured during the first four (MORV) or two (MOBV) weeks of life. The infected individuals are depicted by red dots, whereas the uninfected control group is depicted by white dots. The body weight is depicted as mean with SD, and organ weights are shown as box and whiskers with all data points plotted. Statistical differences in weight are indicated by * p < 0.05 and ** p < 0.01, as determined by the Mann–Whitney test.

