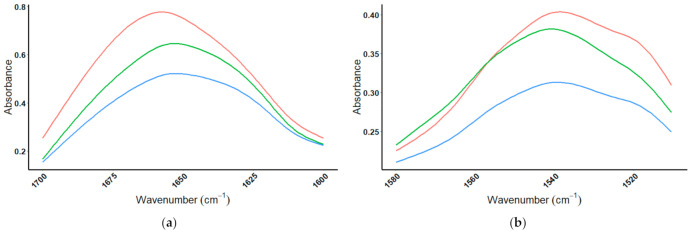
Figure 6.
Amide I and amide II regions, comparing Vega protein powder to protein standards. MIR spectra of plant-based protein product ( = Vega) and protein standards (
 = Brown Rice and
  = Pea, observing (a) the amide I spectral region (1700–1600 cm−1), and (b) the amide II spectral region (1580–1510 cm−1).

