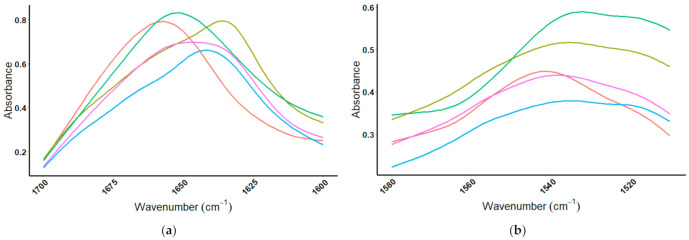
Figure 7.
Amide I and amide II regions comparing ISO100 protein powder to protein standards. MIR spectrum of the four whey protein standards ( = β-lactoglobulin,
  = α-lactalbumin,
  = BSA,
  = IgG), and whey protein product
  = ISO100, in (a) the amide I spectral region (1700–1600 cm−1), and (b) the amide II spectral region (1580–1510 cm−1).

