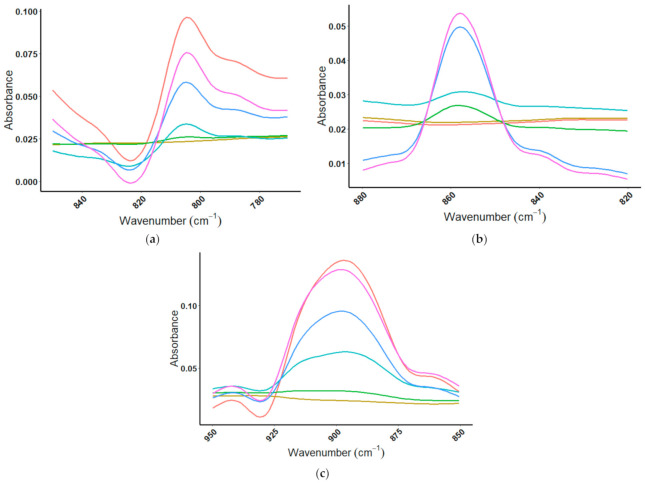
Figure 10.
MIR spectral overlays for ISO100 with increasing amount of amino acid to a ratio of 1:3. (a) Doping with the amino acid glutamic acid spike in the range of 850–770 cm−1 ( = ISO100,
  = ISO100:GA (10:1),
  = ISO100:GA (4:1),
  = ISO100:GA (1:1),
  = ISO100:GA (1:3),
  = GA); (b) doping with the amino acid lysine over the range from 880–820 cm−1 (
 = ISO100,
  = ISO100:Lysine (10:1),
  = ISO100/Lysine (4:1),
  = ISO100:Lysine (1:1),
  = ISO100:Lysine (1:3),
  = Lysine); and (c) doping with the amino acid glycine over the range from 950–850 cm−1 (
 = ISO100,
  = ISO100:Glycine (10:1),
  = ISO100:Glycine (4:1),
  = ISO100/Glycine (1:1),
  = ISO100/Glycine (1:3),
  = Glycine).

