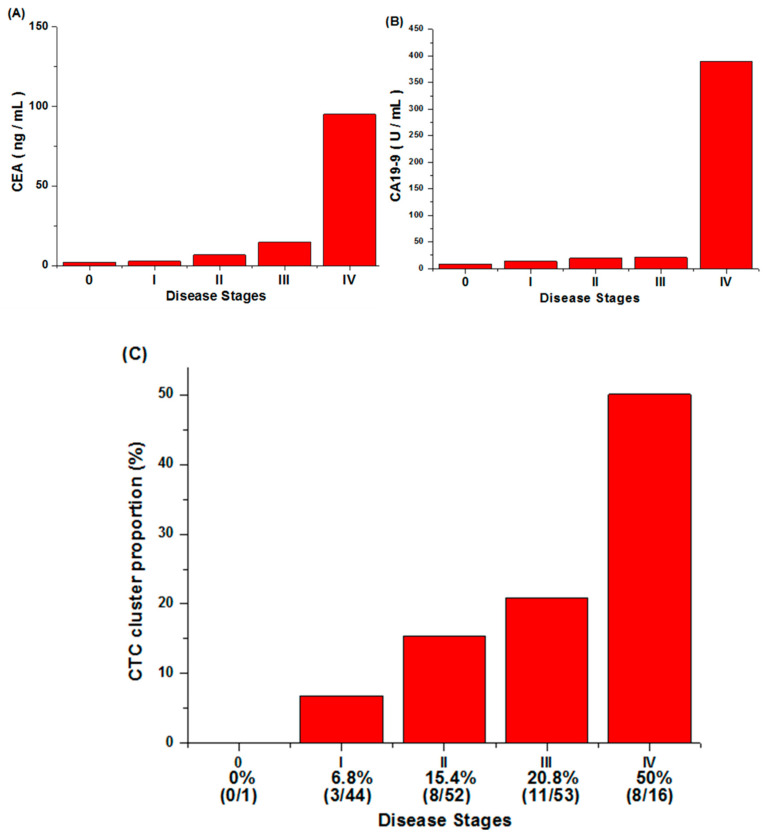
Figure 8.
The relationship between CEA/CA 19-9/CTC cluster levels and disease stages. (A) The correlation between cancer stages and the carcinoembryonic antigen (CEA). It can be seen that the CEA level has a slight upward trend with the increase in disease stage, and it rises significantly at stage IV. (B) The correlation between cancer stages and the carbohydrate antigen 19-9 (CA19-9). The growth trend of CA19-9 in the first three stages is not obvious, but it is significantly increased in stage IV. (C) The percentage of patients with CTC clusters at each cancer stage. The CTC cluster proportion increases steadily as the stage increases.

