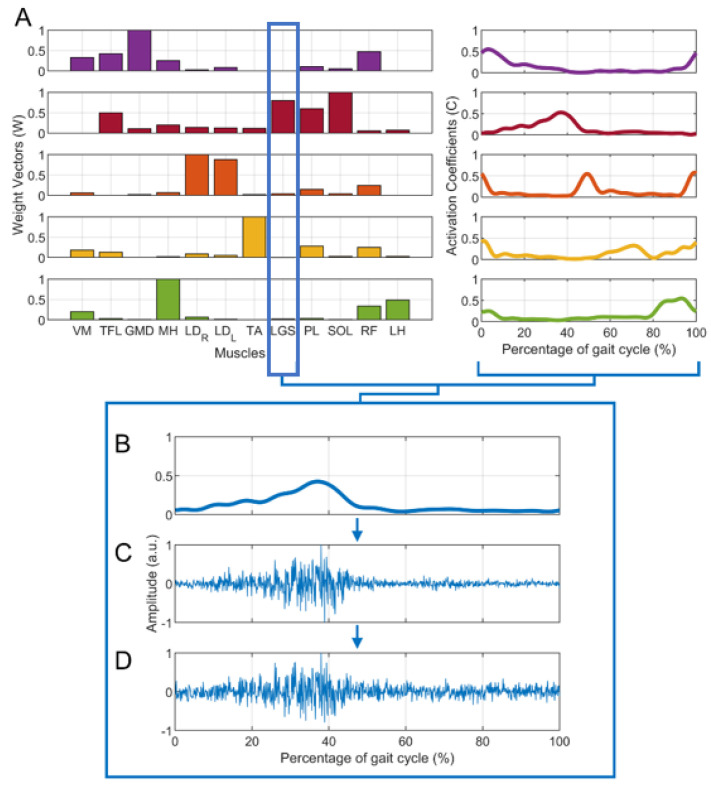
Figure 1.
Example of the generation of a simulated sEMG signal for the lateral gastrocnemius (LGS) muscle: the first step is (A) the extraction of muscle synergies ( and ) from the real data of a representative subject with 5 muscle synergies, the second is (B) the reconstruction of the LGS envelope (obtained as LGS * ). Then, (C) a simulated sEMG signal without additive noise is generated. Finally, noise is added to the previous signals. An example of a simulated sEMG signal with SNR = 20 dB is shown in (D).

