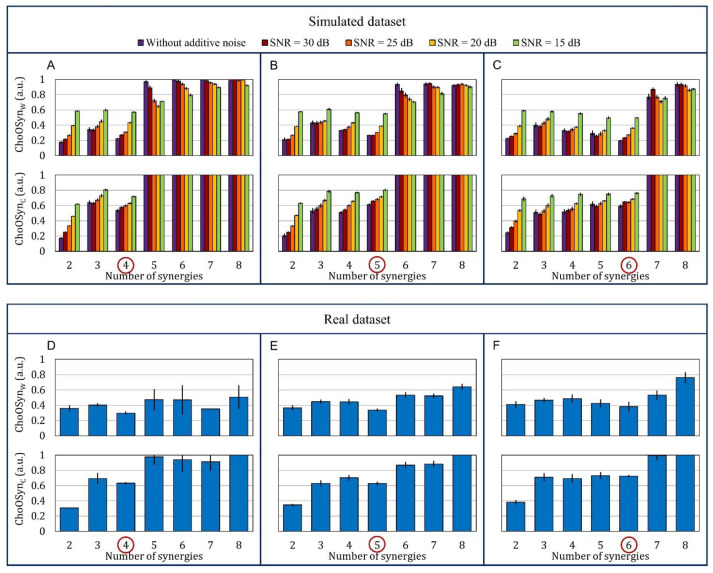
Figure 5.
Bar plots representing the mean ± standard error of the two parameters and . (A–C) Upper plots: simulated dataset. Each bar represents a different noise condition. The dataset is divided into three subsets with (A) 4, (B) 5, and (C) 6 muscle synergies, respectively. (D–F) Bottom plots: real dataset. It is divided into subjects that express (D) 4, (E) 5, and (F) 6 muscle synergies, respectively. We used the ground truth to divide the real dataset into three subsets.

