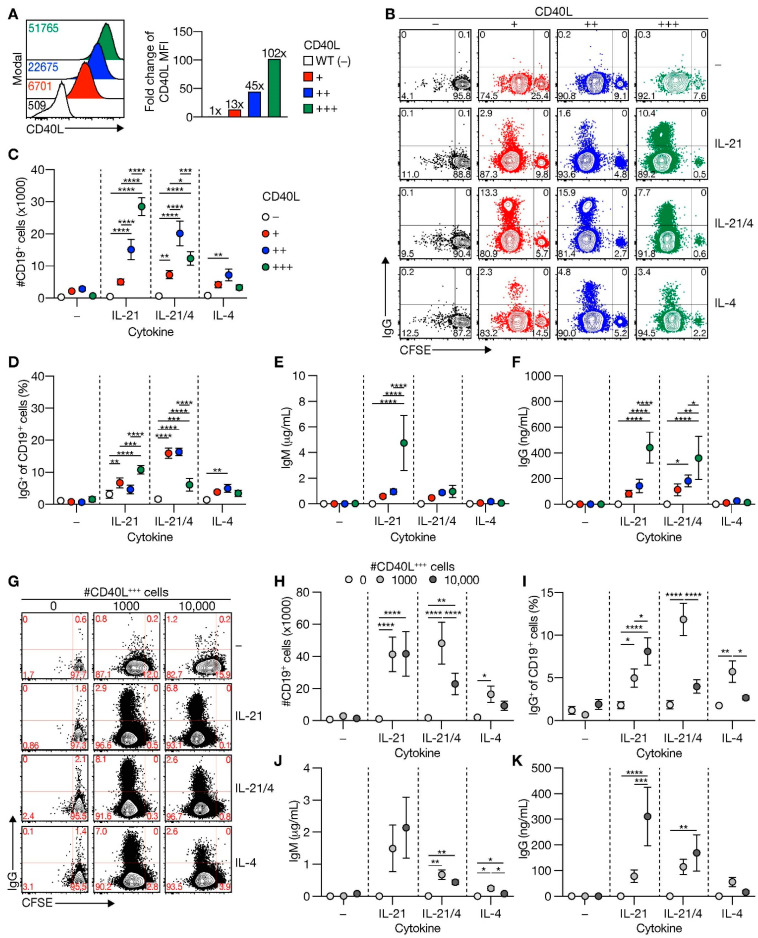
Figure 1.
Level of CD40L expression and number of CD40L feeder cells supports human naive B-cell expansion and IgG class switching. (A) Representative histograms (left) of human CD40L expression stably transfected 3T3 fibroblasts expressing various amounts of human CD40L (+, ++ or +++) compared to non-transfected 3T3 cells (WT; −). Numbers indicate the mean fluorescence intensity (MFI) of CD40L expression. Fold changes compared to WT controls of CD40L MFI are shown in the right panel (data shown represent three separate experiments). (B–D) Human CFSE-labeled naive B-cells were cultured on 3T3 cells expressing varying levels of CD40L with or without IL-21 and/or IL-4 for 6 days and analyzed for proliferation and class switching to surface IgG ((B); representative plots). The number of live CD19+ B-cells (C) and surface IgG-expression (D) was quantified after the cultures by flow cytometry analysis (n = 6). (E–F) Cumulative secretion of IgM ((E); n = 9) and IgG ((F); n = 8) measured in culture supernatants after 11 days. (G) Representative plots of CFSE-labeled human naive B-cells cultured on 0/1000/10,000 CD40L+++-expressing 3T3 cells (supplemented to 10,000 with WT 3T3 cells) with or without IL-21 and/or IL-4 for 6 days. (H–I) Number of live CD19+ events ((C); n = 9) and the frequency of IgG+ cells ((D); n = 7) after culture on 0/1000/10,000 CD40L+++-expressing 3T3 cells, and cytokines for 6 days. (J–K) Cumulative IgM ((F); n = 7) and IgG ((G); n = 7) levels measured in culture supernatants after 11 days. Data are shown as mean ± SEM of independent experiments. Single experiments were conducted in triplicate. Data were analyzed by a two-way ANOVA followed by Tukey’s multiple comparison test. * P ≤ 0.05, ** P ≤ 0.01, *** P ≤ 0.001, **** P ≤ 0.0001.

