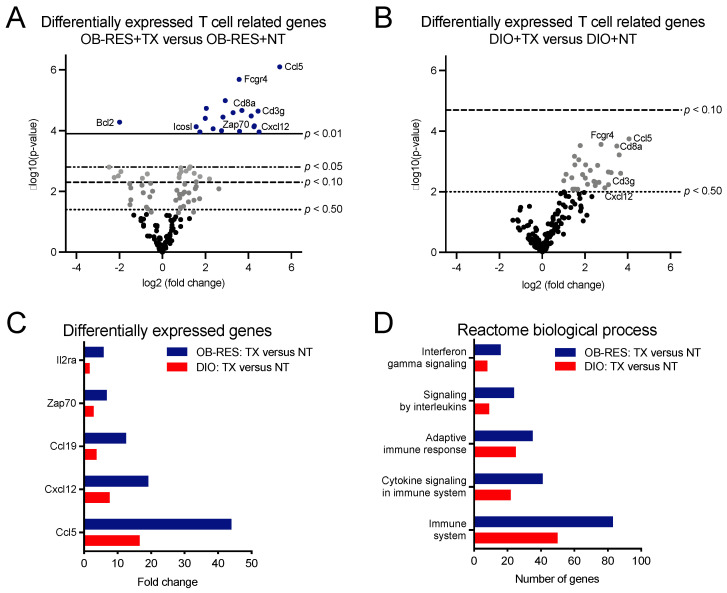
Figure 3.
Immunogenetic profiling of renal tumors illustrates that OB-RES mice have a more robust anti-tumor T cell response following therapy administration than do DIO mice. (A,B) Volcano plots showing the expression of 153 T cell related genes from tumors harvested at day 21 post-tumor challenge in (A) therapy-treated OB-RES versus OB-RES no therapy controls and (B) therapy-treated DIO versus DIO no therapy controls (both panels, n = 3–8/group). Lines represent exploratory unadjusted p-value thresholds to screen for differentially expressed target genes. (C) Selected differentially expressed genes. (D) Differentially expressed T cell related pathways queried using Reactome biological processes. NT: no therapy, TX: AdT/CpG+αCTLA-4.

