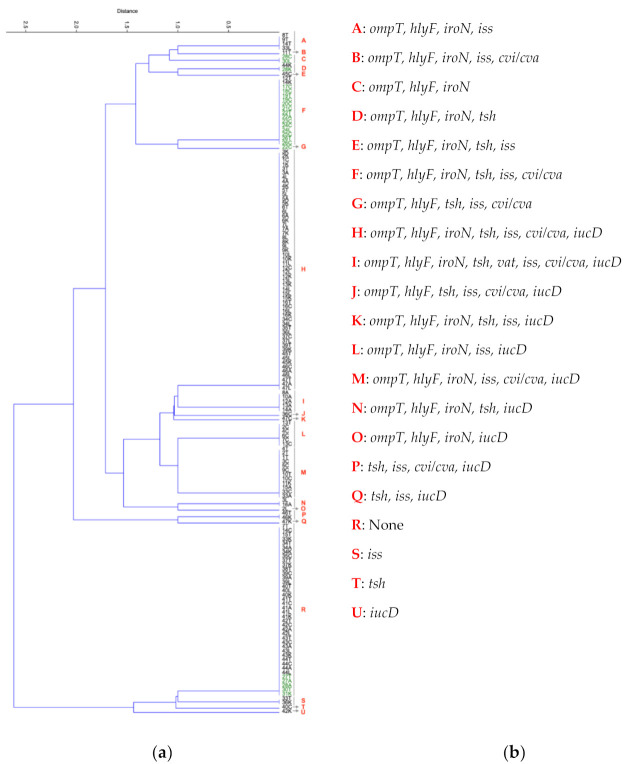
Figure 2.
Agglomerative hierarchical algorithm illustrating the similarity amongst E. coli isolates from air sac, cloacal, kidney, liver, and trachea samples isolated from non-healthy and healthy chicken samples based on the presence and absence of APEC associated virulence genes. (a) The distance (y-axis) represents how closely related the clustered samples are relative to each other. Samples in black are from non-healthy chickens and samples in green are from healthy chickens. Numbers indicate chicken sample ID. Sample types are labeled as Air sac (A), cloacal (C), Kidney (K), Liver (L), and Trachea (T). The samples are clustered as follows. In cluster A (8T, 9T, 14T, 33L). In cluster B (11T), In cluster C, (28C, 30L). In cluster D, (44K, 28K). In cluster E, (45C). In cluster F, (12T, 14K, 17C, 18C, 19T, 19C, 20C, 21C, 22T, 22A, 23C, 24C, 24L, 25C, 26T, 26C). In cluster G, (22C). In cluster H, (3K, 2K, 1C, 1K, 3T, 3A, 4L, 4A, 4K, 5T, 5L, 5A, 5K, 6T, 6L, 6A, 6K, 7L, 7A, 7K, 8L, 8K, 9L, 9K, 10L, 10K, 11L, 12C, 12L, 12K, 13L, 13K, 14L, 15L, 15K, 16T, 16C, 16L, 16K, 34C, 34L, 35T, 36L, 37C, 37L, 39T, 39K, 45T, 45L, 45K, 46C, 46A, 46L, 47T, 47A, 47L). In cluster I, (8A, 10A, 12A, 13A, 14A). In cluster J, (36C). In cluster K, (47C). In cluster L, (13T, 2C, 4C, 6C, 7C, 13C). In cluster M, (4T, 2T, 1T, 3C, 5C, 9C, 10T, 10C, 11K, 15A, 33C, 33A). In cluster N, (3L, 16A). In cluster O, (2L). In cluster P, (46T, 46K). In cluster Q, (47K). In cluster R, (7T, 14C, 15T, 33K, 34T, 34A, 34K, 35C, 37T, 37K, 38T, 39C, 39A, 39L, 40T, 40L, 40K, 41T, 41C, 41A, 41L, 41K, 42T, 42C, 42A, 42L, 43T, 43C, 43A, 43L, 43K, 44T, 44C, 44A, 44L, 27T, 27A, 28A, 30T, 31K). In cluster S, (33T, 36K). In cluster T, (40C). In cluster U, (42K). (b) The APEC associated virulence genes linked to each cluster.

