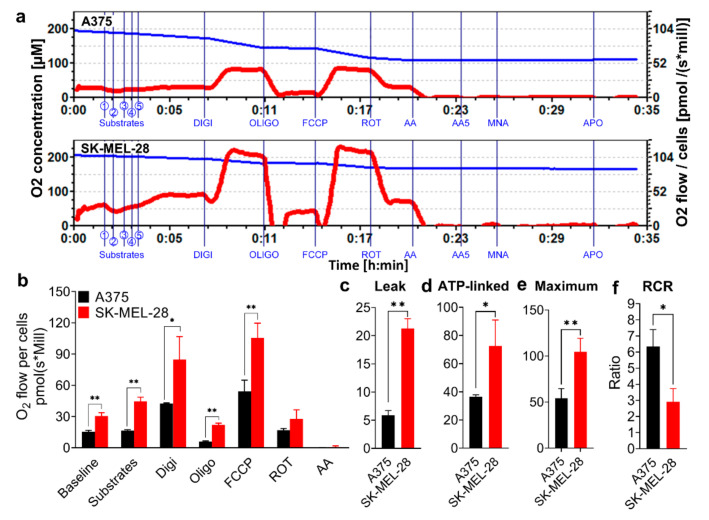
Figure 1.
Comparative mitochondria phenotypes in melanoma cell lines. A375 and SK-MEL-28 cells were counted and placed in the Oroboros respiratory chambers, with sequential injections of Cx I and Cx II substrates (① L-glutamate; ② L-malic; ③ ADP; ④ pyruvate; ⑤ succinate), Digi (8.1 mM), Oligo (5 mM), FCCP (1 mM), ROT (1 mM), and AA (5 mM). (a) The O2 concentration (blue line) and OCR for per million A375 and SK-MEL-28 cells (red line) were monitored in real-time. (b) The stable OCR values for per million A375 and SK-MEL-28 cells, measured by Oroboros, are displayed in the bar graph (n = 3). The data accessed from Oroboros was further calculated. The results are shown as (c) proton leak, (d) ATP-linked respiration, (e) maximum respiration, and (f) RCR, which means the State 3 over State 4 oligo. Results are expressed as mean ± SD. * p < 0.05, ** p < 0.01. Cx I, complex I; Cx II, complex II; ADP, adenosine diphosphate; Digi, digitonin; Oligo, oligomycin; FCCP, carbonyl cyanide-4-(trifluoromethoxy) phenylhydrazone; ROT, rotenone; AA, antimycin A; OCR, oxygen consumption rate; ATP, adenosine triphosphate; RCR, respiratory control ratio; SD, standard deviation.

