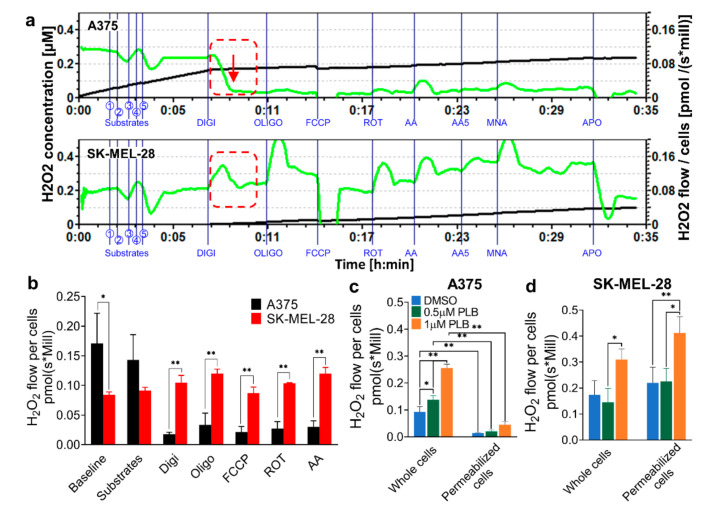
Figure 2.
H2O2 production rate for whole and permeabilized melanoma cells at basal and PLB induced levels. A375 and SK-MEL-28 cells were counted and placed in the Oroboros respiratory chambers, with sequential injections of Cx I and Cx II substrates (① L-glutamate; ② L-malic; ③ ADP; ④ pyruvate; ⑤ succinate), Digi (8.1 mM), Oligo (5 mM), FCCP (1 mM), ROT (1 mM), and AA (5 mM). H2O2 signals were detected by Amplex UltraRed. (a) The H2O2 level (black line) and H2O2 flow for per million A375 and SK-MEL-28 cells (green line) were monitored in real-time. The red dashed box, along with a red arrow, highlights the H2O2 production drop in A375 cells compared to SK-MEL-28 cells. (b) The stable H2O2 flow values for per million A375 and SK-MEL-28 cells are displayed in the bar graph. (n = 3) The H2O2 production rates for whole and permeabilized (c) A375 cells and (d) SK-MEL-28 cells with DMSO and 1 and 3 µM PLB treatments are represented as the H2O2 flow before and after digitonin is applied (n = 3). Results are expressed as mean ± SD. * p < 0.05, ** p < 0.01. DMSO, dimethyl sulfoxide; PLB, plumbagin.

